Uniswap Price Prediction Highlights Market Recovery Amid Bullish Momentum
Uniswap (UNI) price prediction is showing early signs of a market rebound, supported by a combination of bullish chart patterns and moderate technical momentum. Over the past 48 hours, price activity has reflected a pote...
Archive context
Older archive item. Useful for background and entity history, but not a fresh market-moving signal.

Uniswap (UNI) price prediction is showing early signs of a market rebound, supported by a combination of bullish chart patterns and moderate technical momentum. Over the past 48 hours, price activity has reflected a potential turnaround despite minor retracements.
With the broader crypto market stabilizing, UNI’s recovery narrative is gaining traction, backed by identifiable technical setups.
Bullish Pennant Signals Possible Upside ContinuationIn a recent X post, market analyst Crypto Joe (@CryptoJoeReal) identified a bullish pennant and flag pattern forming on the 1-hour UNI/USDT chart. The chart showed a classic consolidation phase within converging trendlines following a prior rally, a structure typically associated with bullish continuation.
After breaking out of this pattern, the price moved toward the $7.40–$7.50 range before encountering short-term resistance. This move suggests market participants are beginning to re-engage following a period of reduced volatility.
Source: X
The pennant’s formation and breakout are further supported by volume dynamics, with buying volume increasing during the breakout phase. Additionally, the 200-period moving average, positioned around $6.94, has served as a critical support level. As long as UNI holds above this region, upward potential remains intact.
Analyst Crypto Joe projects a potential target of $8.477, assuming continued adherence to the current bullish structure. However, if the price falls below the pennant’s trendline, a retest of key support around $6.90 could follow.
Price Trend and On-Chain Metrics Indicate Cautious OptimismAccording to Brave New Coin, UNI is currently priced at $7.08, reflecting a 2.16% decline over the past 24 hours. Despite this minor dip, the token maintains a market capitalization of approximately $4.25 billion, positioning it at rank 35 among cryptocurrencies.
Source: Brave New Coin
Trading volume stands at $316.77 million, indicating steady market activity even in the absence of sharp price movement. The overall structure remains constructive, with the price largely consolidating near previous breakout zones.
Supporting the technical outlook, another analyst, @UniChartz, shared a trade setup on the 1-hour chart, recommending a long entry at $7.24 with a stop-loss at $7.03 and a target of $7.87. This setup was based on UNI’s recent move above a key resistance level, which was accompanied by positive momentum.
Source: X
If this level is reclaimed with adequate volume, the short-term upside may extend toward the $7.80 range. Combined with the data from Brave New Coin, these observations reinforce the idea that UNI may be positioning for its next upward leg.
Momentum Indicators Show Buyer Control but Call for CautionOn the other hand, the daily candlestick chart for UNI/USDT on TradingView shows UNI trading at $6.632, a modest 0.64% increase in the most recent session. The current price action suggests mild recovery following recent resistance rejection near $7.00.
The pattern of lower highs over recent days signals consolidation rather than a definitive trend reversal, and price movement continues to hover near a significant support level.
Source: TradingView
Technical indicators offer mixed signals. The Awesome Oscillator (AO) prints a mildly positive value of 0.076, indicating weak bullish momentum that could grow if reinforced by volume. Meanwhile, the Balance of Power (BoP) stands at 0.61, a value that favors buyers.
This suggests that despite modest price fluctuations, the underlying sentiment remains tilted toward accumulation. If price action continues to stabilize above $6.50 with support from buyers, the possibility of retesting resistance between $7.00 and $7.20 remains viable in the near term.
Why this matters
This research story adds another data point to the current market tape and is useful when read alongside nearby source coverage.
Original source
Read on Brave New CoinRelated market context

XRP Price Prediction: Chart Mirroring 2016, Targeting $23
XRP trades at around the $1.50 price level, slightly down, but a long-range chart comparison points to a $23 prediction. The resem...

Microsoft Copilot AI Predicts Chainlink (LINK) Could Hit $100 in 2026
Microsoft Copilot AI predicts that in a world where Chainlink becomes the backbone of a major global settlement system, such as SW...
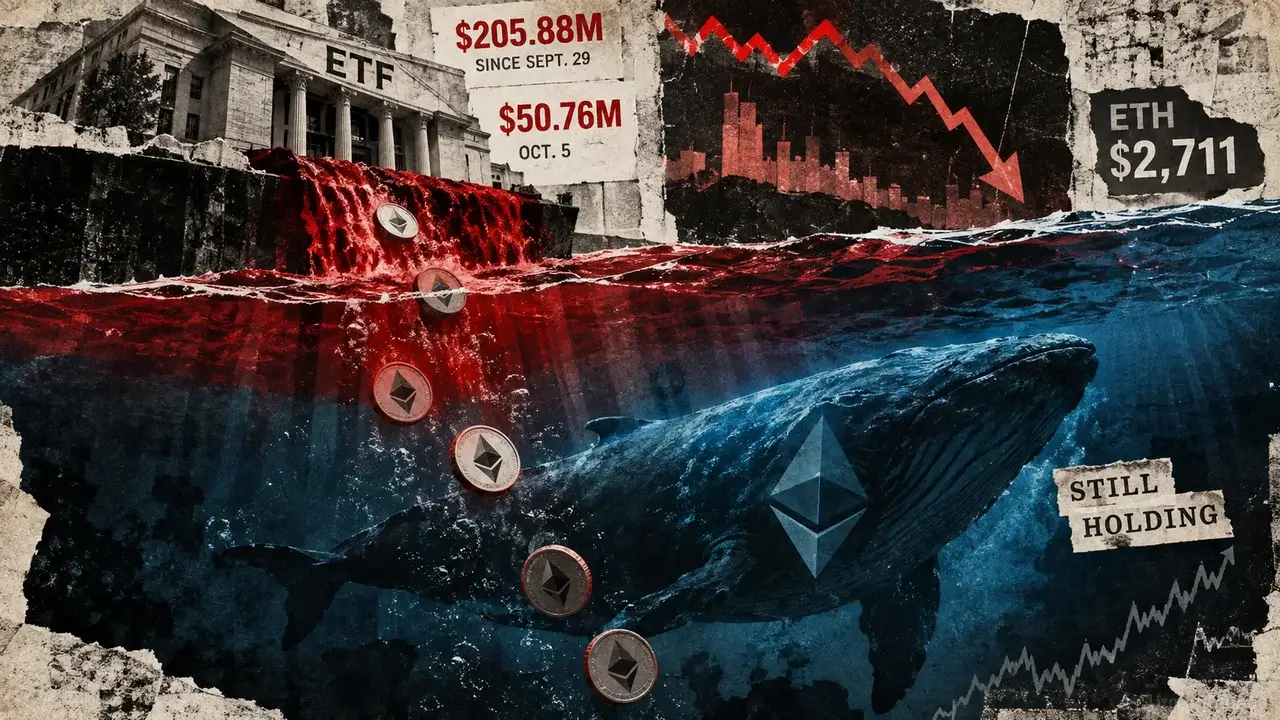
Ethereum bears keep selling but ETH price stays near $2,700 as US spot ETFs record $206M in outflows
Ethereum’s institutional demand is weakening around the same time derivatives positioning shows traders are selling aggressively w...

Mark Zuckerberg Meta AI Predicts Double-Digit XRP Price by 2026
Currently priced at approximately $1.50, Mark Zuckerberg’s Meta AI predicts that XRP could surge above $10 this year, a gain of ar...

Near co-founder says liquidity remains the biggest challenge for tokenized stocks
NEAR co-founder Illia Polosukhin says fragmented liquidity remains a major obstacle for tokenized stocks as NEAR Intents looks to...

Google Gemini AI Predicts Chainlink (LINK) to Hit $300 by 2027
Google Gemini AI predicts that, assuming a full-blown crypto bull market returns and is turbocharged by a landmark catalyst, LINK...