Uniswap Price Prediction Signals 77% Rally as Bulls Reclaim $10
The breakout from a prolonged consolidation period has shifted sentiment in the DeFi sector, with UNI now trading above levels last seen in early 2024. Analysts are monitoring this movement as a possible signal of a long...
Archive context
Older archive item. Useful for background and entity history, but not a fresh market-moving signal.

The breakout from a prolonged consolidation period has shifted sentiment in the DeFi sector, with UNI now trading above levels last seen in early 2024.
Analysts are monitoring this movement as a possible signal of a longer-term trend reversal. At the time of writing, UNI remains positioned above the $10.00 threshold, signaling sustained buying pressure.
Breakout Above $10.00 Revives Long-Term Upside ProspectsAnalyst @CryptoBull_360 highlighted a decisive move on the UNI/USDT daily chart, where Uniswap surged past a horizontal resistance band between $9.60 and $10.80. This zone, which had capped price advances since March, was previously a key support region during late 2023 and early 2024.
The recent breakout marks a shift in market structure, signaling a change from sideways action to a potential bullish trend.
Source: X
The move also represents a technical reclaim of higher levels, with price now printing higher lows and attempting to sustain momentum. The projected upside target of approximately $18.40 is based on the height of the prior consolidation range applied to the breakout level.
If the price holds above this reclaimed zone, it could act as a solid support base. The long-term significance of breaking out of such a well-defined range lies in its potential to accelerate further gains, especially if market conditions remain favorable.
Short-Term Volatility Accompanies Moderate GainsThe 24-hour chart shows UNI closed at $10.18, posting a 2.74% gain for the period. Early in the session, price action moved above $10.50, peaking around $10.65 before encountering resistance.
A gradual pullback followed, and the token returned toward the $10.00 zone. This movement reflects the volatility typically associated with fresh breakouts, where early buyers often lock in profits after initial surges.
Source: BraveNewCoin
During the late hours of July 18 through to July 19, UNI’s trajectory showed signs of consolidation. The price temporarily dipped below $10.00 but rebounded to $10.25 before closing lower.
Despite modest recovery attempts, trading volume during the rebound remained stable, indicating measured buying interest. With $1.49 billion in daily volume and a market cap of approximately $6.11 billion, UNI maintains its position as a top-tier DeFi asset.
Technical Indicators Signal Strength at Time of WritingOn the daily chart from TradingView, Uniswap is trading at $10.311 after a 1.71% intraday gain. The rally, which began in mid-June, continues to form higher highs and higher lows—key components of a bullish trend. Price action is situated above the middle Bollinger Band (20-day SMA) at $8.223, confirming strong bullish bias.
The upper Bollinger Band now curves upward near $10.261, and price remains in contact with this level, suggesting persistent buyer dominance.
Source: TradingView
The Bollinger Band Power (BBP) indicator supports this trend continuation, with its recent value at 2.387. This metric has shifted to a positive value after months of low activity, indicating rising volatility in a bullish direction. The previous contraction phase between April and June has now transitioned into expansion, a pattern often associated with new directional moves.
While intraday wicks hint at profit-taking, the broader structure remains intact. As long as UNI sustains its position above the $8.223 basis, upward movement toward $12.83 or higher remains plausible.
Why this matters
This research story adds another data point to the current market tape and is useful when read alongside nearby source coverage.
Original source
Read on Brave New CoinRelated market context

What Is Crypto Spot Trading?
For example, a token can be up 70% and still be a terrible trade if you have no idea when to take profits. Likewise, a 30% dip can...

Bitcoin Price Briefly Reclaims $81,000 as Liquidations Top $1 Billion
Bitcoin price fell for a fourth consecutive day, briefly slipping below $81,000 before rebounding, as the total crypto market cap...

Bitcoin (BTC) Price Today: $81.1K Becomes Critical as Traders Eye Double-Bottom Setup
Bitcoin recently climbed above $85,000 before encountering renewed selling pressure. Glassnode’s latest Week On-Chain report shows...

Bitcoin crashes through $81,000 buy wall as $1 billion crypto liquidation bloodbath unfolds
Bitcoin registered an intraday low near $80,000 as a cryptocurrency selloff triggered over $1 billion in liquidations, overwhelmin...
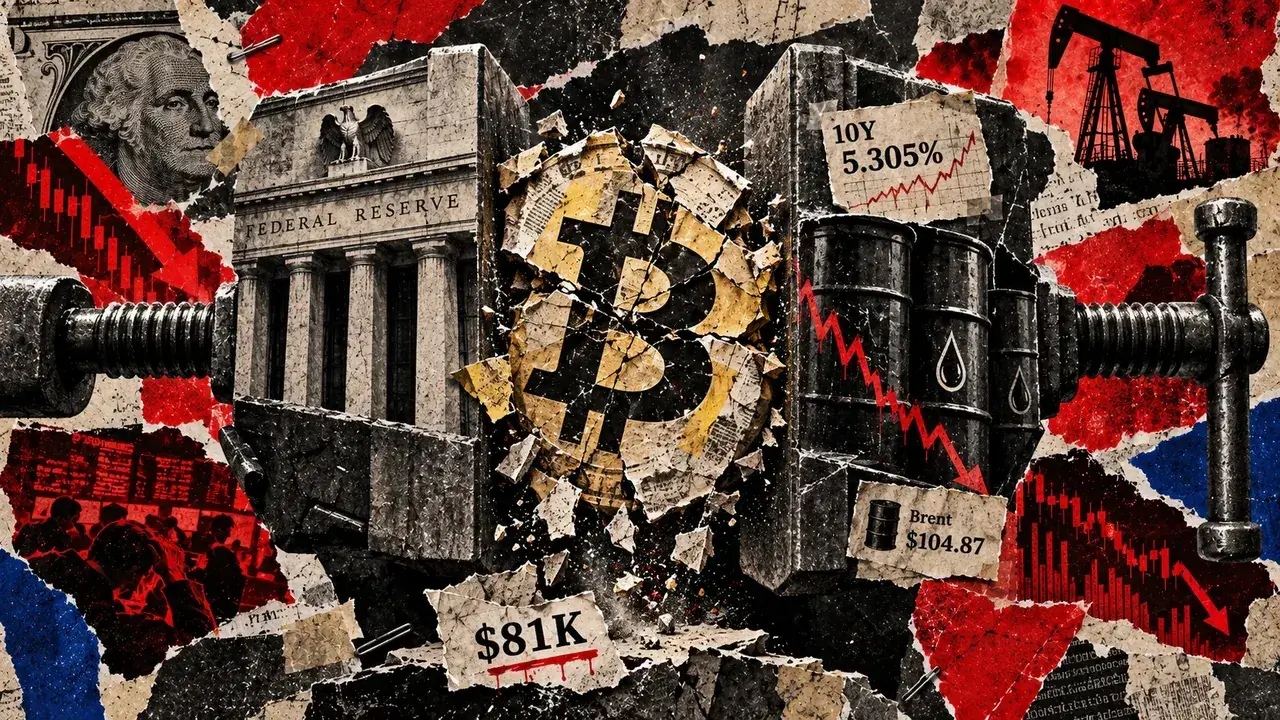
Bitcoin’s slide below $81,000 exposes why a Fed pause may not save the crypto market
Bitcoin slid below $81,000 on Oct. 8, with an intraday low near $80,800, even as traders expect the Fed to hold in October. The Se...

Bitcoin long liquidations hit largest level since early June
The recent Bitcoin liquidation highlights the risks of high leverage in crypto trading, emphasizing the need for cautious risk man...