Volume profile indicators now available on Kraken Desktop
TL;DR Four native volume profile tools are now live on Kraken Desktop: Volume Profile Visible Range (VPVR), Volume Profile Fixed Range (VPFR), Anchored Volume Profile (AVP), and Session Volume Profile (SVP). VPVR is a ch...
Archive context
Older archive item. Useful for background and entity history, but not a fresh market-moving signal.

- Four native volume profile tools are now live on Kraken Desktop: Volume Profile Visible Range (VPVR), Volume Profile Fixed Range (VPFR), Anchored Volume Profile (AVP), and Session Volume Profile (SVP).
- VPVR is a chart-wide overlay that updates dynamically as you pan or zoom, showing volume distribution across your current view.
- AVP and SVP track developing structure from a chosen point in time or across trading sessions, with up to 90 days of session history available on demand.
- Analysis and execution now live in the same workstation, so the level you spot is the level you trade from, without a separate charting tool.
A price chart shows you where the market has been. Volume profile shows you where it actually traded the most, and where it barely traded at all.
Kraken Desktop now shows both. Four native volume profile indicators, Volume Profile Visible Range (VPVR), Volume Profile Fixed Range (VPFR), Anchored Volume Profile (AVP), and Session Volume Profile (SVP), are live on Desktop today, giving traders a way to read market structure and act on it without leaving the platform.
Why volume profile mattersMost charts show a single dimension well: where price has traded over time. Volume profile adds a second axis, plotting how much volume traded at each price level instead of at each moment in time.
The resulting histogram surfaces structure that price action alone can’t: the point of control, the price level with the most traded volume; the value area, the range where the bulk of activity concentrated; and the low-volume nodes, the thinner patches where price tends to move quickly because few trades happened there.
For traders who build a thesis around market structure, that’s the difference between guessing where a level might hold and knowing where the market has already shown its hand.
Four native tools, one workstationEach indicator is suited to a different way of reading structure.
VPVR: Volume Profile Visible RangeA chart-wide overlay in the Analysis panel. VPVR renders a right-anchored histogram of volume across whatever time window is currently on screen, and it updates dynamically as you pan or zoom. It’s the fastest way to read where volume has concentrated in the range you’re already looking at.
VPFR: Volume Profile Fixed RangeA drawing tool for more deliberate analysis. Drag a time and price box across a specific set of candles, and VPFR profiles the volume inside that exact selection, useful for studying a prior range or a specific move on its own.
AVP: Anchored Volume ProfileAlso a drawing tool. Anchor AVP to a single point in time, a high, a low, a news event, a session open, and it profiles cumulative volume from that point forward to the right edge of the chart. Use it to track how structure develops after a specific moment.
SVP: Session Volume ProfileSVP needs no setup. It renders automatically for each UTC day or equity session, and scrolling back triggers an on-demand fetch of up to 90 days of session history, so session-by-session structure is always there when you need it.
Analysis and execution, without leaving DesktopAll four tools are native to Kraken Desktop, not an overlay pulled in from somewhere else. That distinction matters in practice: when structural analysis and order entry live in the same environment, the level you identify is the level you trade from. There’s no tab to switch and no second window to reconcile before you can act.
Desktop’s native performance, running on local compute instead of in a browser, means these overlays render and update smoothly even as markets move fast. It’s the kind of analysis that has historically lived in institutional platforms and dedicated charting software, built directly into the workstation you already use to trade.
Not on Kraken Desktop yet? Download Kraken Desktop today.
Volume profile trading on Kraken DesktopThe post Volume profile indicators now available on Kraken Desktop appeared first on Kraken Blog.
Why this matters
Kraken is showing up inside the AI Crypto theme, so this story is worth tracking for follow-through rather than treating it as a one-off headline.
Original source
Read on Kraken BlogRelated market context

Google Gemini AI Predicts Chainlink (LINK) to Hit $300 by 2027
Google Gemini AI predicts that, assuming a full-blown crypto bull market returns and is turbocharged by a landmark catalyst, LINK...

Mark Zuckerberg Meta AI Predicts Double-Digit XRP Price by 2026
Currently priced at approximately $1.50, Mark Zuckerberg’s Meta AI predicts that XRP could surge above $10 this year, a gain of ar...
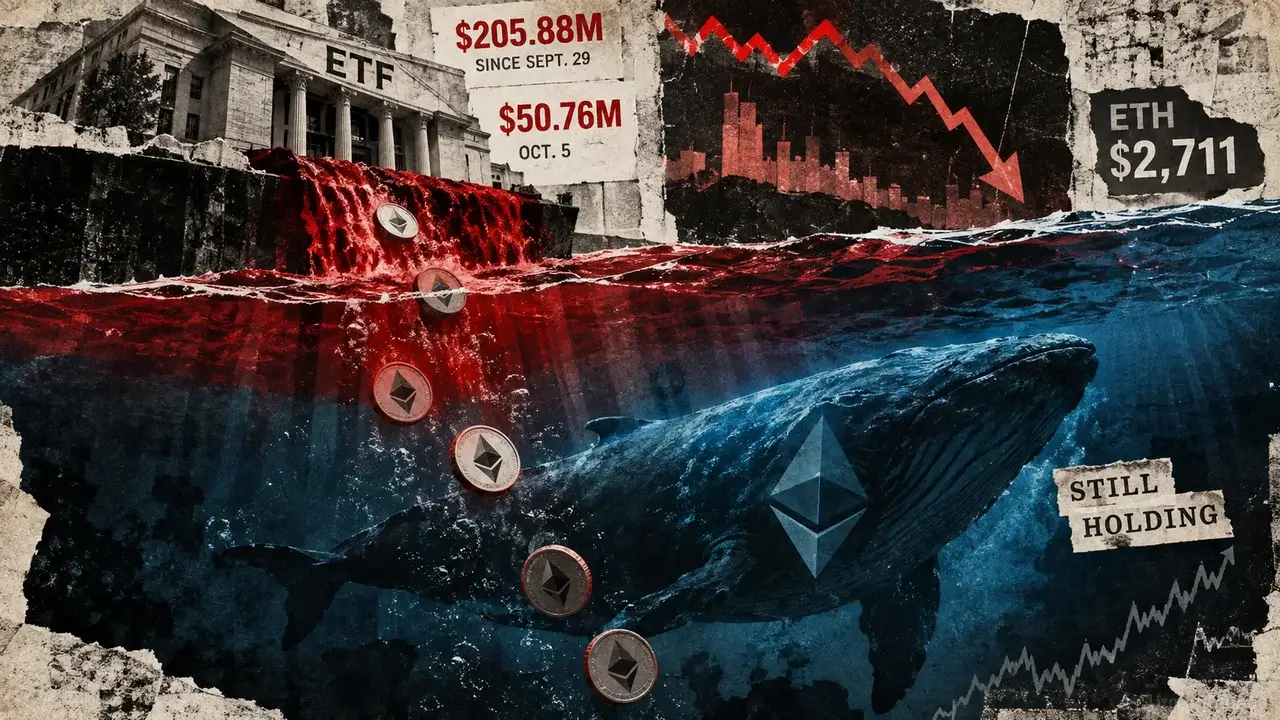
Ethereum bears keep selling but ETH price stays near $2,700 as US spot ETFs record $206M in outflows
Ethereum’s institutional demand is weakening around the same time derivatives positioning shows traders are selling aggressively w...

XRP Price Prediction: Chart Mirroring 2016, Targeting $23
XRP trades at around the $1.50 price level, slightly down, but a long-range chart comparison points to a $23 prediction. The resem...

Pudgy Penguins Owner Is Shutting Down Its Abstract Chain, Where $47 Million Still Sits
Abstract, the Ethereum layer 2 that Pudgy Penguins parent Igloo Inc. built to bring everyday users onchain, will shut down on Dec....
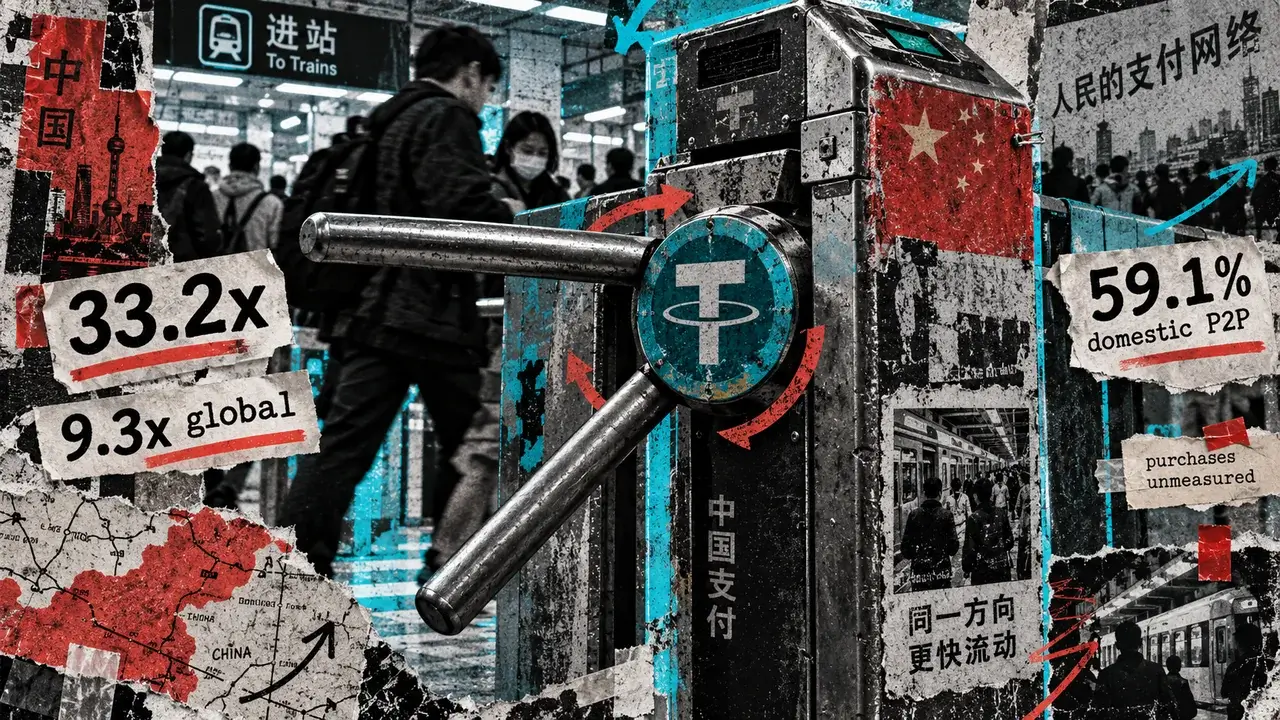
China’s crypto ban Is failing to stop a $176 billion P2P economy
China’s underground crypto economy is increasingly shifting toward peer-to-peer stablecoin payments despite Beijing’s longstanding...