Solana Price Attempts To Bounce Back But Will It Breach $15?
After a period of sluggish price action, the price of Solana has finally made a significant recovery on the chart. In the last week, the coin has surged over 9%. Although SOL might be moving up slowly, from a technical s...
Archive context
Older archive item. Useful for background and entity history, but not a fresh market-moving signal.

After a period of sluggish price action, the price of Solana has finally made a significant recovery on the chart. In the last week, the coin has surged over 9%. Although SOL might be moving up slowly, from a technical standpoint, the altcoin has recovered and might stage a rally in the upcoming trading sessions.
Buyers were gradually re-entering the market, indicating that SOL registered accumulation. However, capital inflows remained low. With consistent upward price action, capital inflow will also register a positive change.
Now that SOL has made small gains each day, the next resistance mark for the coin stands at $15. If Solana’s price breaks past $15, the coin can rally to $18. Although the Solana price has shown signs of recovery, it is still too early to say if the coin has gotten out of the woods. One push from the bears will bring SOL down to its closest support level.
Solana Price Analysis: One-Day Chart Solana was priced at $13.73 on the one-day chart | Source: SOLUSD on TradingViewSOL was trading at $13.73 at the time of writing. At the moment, SOL was resting above the $13 support line. There needs to be support from buyers and the broader market for Solana to topple above the $14 price mark.
The aforementioned price ceiling should not be too difficult to surpass, given that the altcoin has been trading quite close to that level. On the other hand, the first support for Solana’s price was $13. Failing to remain above that will bring the coin down to $10.50. The amount of Solana traded in the past session was green, depicting a bullish preference.
Technical Analysis Solana registered increased buying strength on the one-day chart | Source: SOLUSD on TradingViewSOL had witnessed quite the plunge in the month of November. The altcoin entered the oversold region twice this month. At press time, however, Solana had portrayed an increase in demand.
The Relative Strength Index noted an uptick and inched closer to the 40-mark. This reading denoted a rise in accumulation. Solana’s price was also above the 20-Simple Moving Average line, which indicated bullishness and that buyers would drive the price momentum in the market.
Solana displayed a fall in capital inflows on the one-day chart | Source: SOLUSD on TradingViewIn terms of institutional interest, SOL has registered mundane performance for months. Despite the chart’s recovery, SOL’s capital inflows have remained low, mostly due to the broader market’s weakness. The Chaikin Money Flow (CMF) indicated capital inflows and outflows.
CMF was below the half-line, indicating that outflows were greater than inflows. The Awesome Oscillator (AO) displays the trend and price momentum. AO was positive with green signal bars, which were tied to the buy signal for the altcoin. This also suggested further gains for Solana investors.
Featured image from Mudrex, Chart: TradingView.comWhy this matters
This security story adds another data point to the current market tape and is useful when read alongside nearby source coverage.
Original source
Read on NewsBTCRelated market context

Bitcoin (BTC) Price Prediction: $66,400 Breakout Could End Months of Range-Bound Trading
The market’s next major directional signal could come from a break of the $62,200-$66,400 range, as Bitcoin continues to consolida...
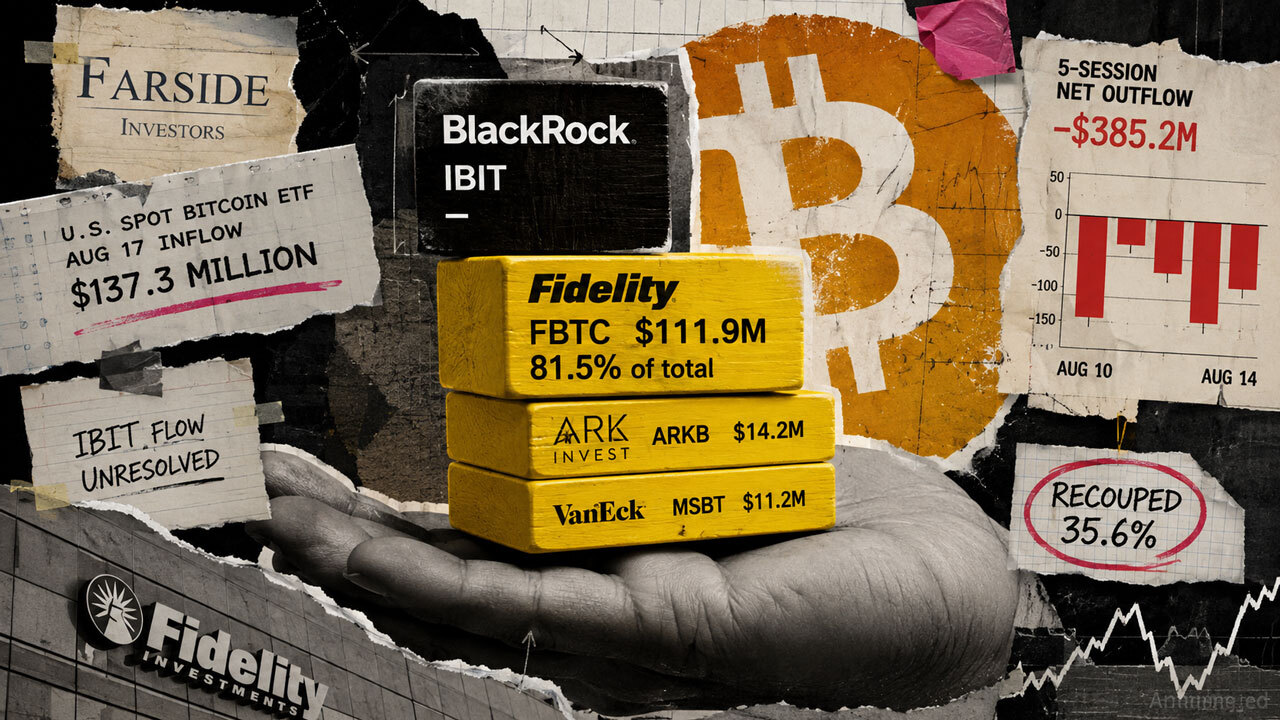
Bitcoin ETF flows jumped by $137 million, but it only recouped a third of recent losses
Farside’s currently reported $137.3 million U.S. spot Bitcoin ETF inflow on Aug. 17 rested heavily on Fidelity, leaving the sessio...

Cash App's crypto support expands beyond bitcoin and USDC via MoonPay
Eligible Cash App users will be able to use their balances to purchase digital assets offered by MoonPay, which include ether, sol...
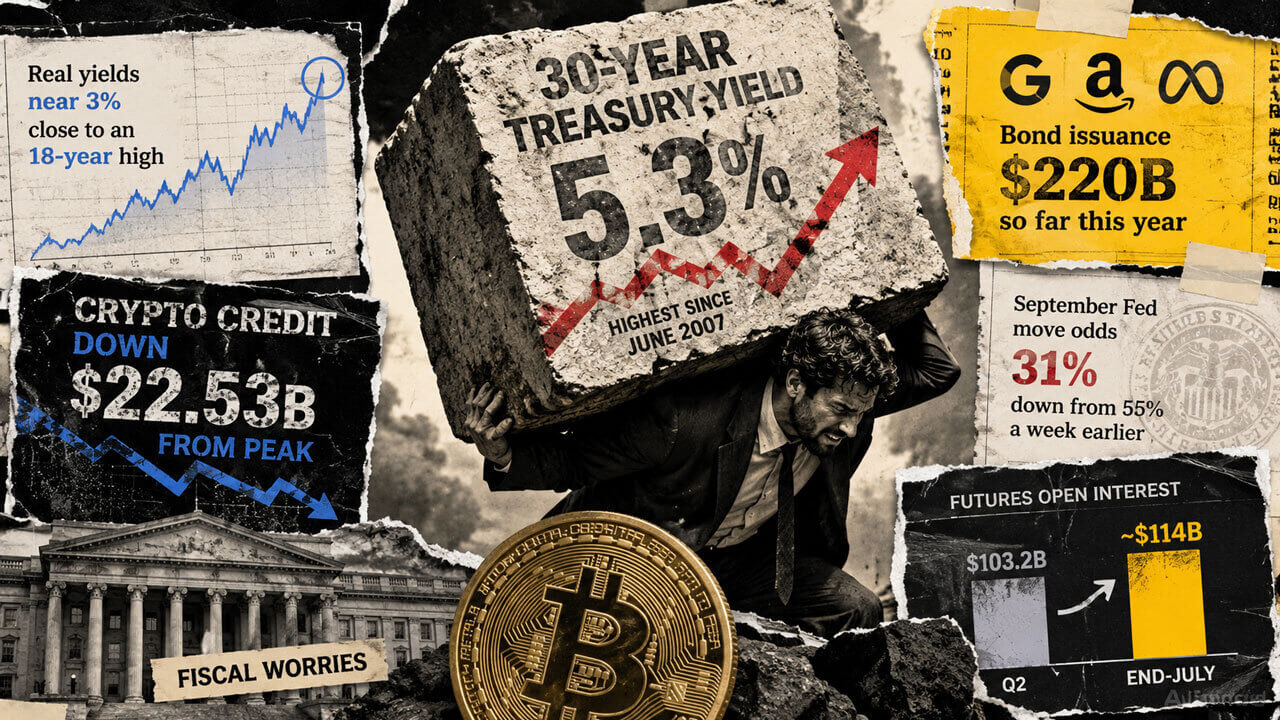
Bitcoin faces its highest Treasury hurdle since 2007 with $22.5B less crypto credit to unwind
The US 30-year Treasury yield crossed 5.3% on Aug. 17 for the first time since June 2007, the same day Galaxy published a report s...

Cash App crypto support beyond Bitcoin and USDC via MoonPay remains speculative
Speculation around Cash App's crypto expansion highlights the challenges of navigating partnerships and market expectations in fin...

Bitcoin as Digital Real Estate: An Excerpt from Leon Wankum’s Digital Real Estate
Bitcoin Magazine Bitcoin as Digital Real Estate: An Excerpt from Leon Wankum’s Digital Real Estate Bitcoin can be understood throu...