ADA Price Is Showing Early Signs of Fresh Drop, But 100 SMA Is The Key
Cardano’s price started a fresh decline below $0.264. ADA is struggling and might accelerate lower if there is a close below the $0.250 support. ADA price is gaining bearish momentum below the $0.265 level against the US...
Archive context
Older archive item. Useful for background and entity history, but not a fresh market-moving signal.

Cardano’s price started a fresh decline below $0.264. ADA is struggling and might accelerate lower if there is a close below the $0.250 support.
- ADA price is gaining bearish momentum below the $0.265 level against the US dollar.
- The price is trading above $0.250 and the 100 simple moving average (4 hours).
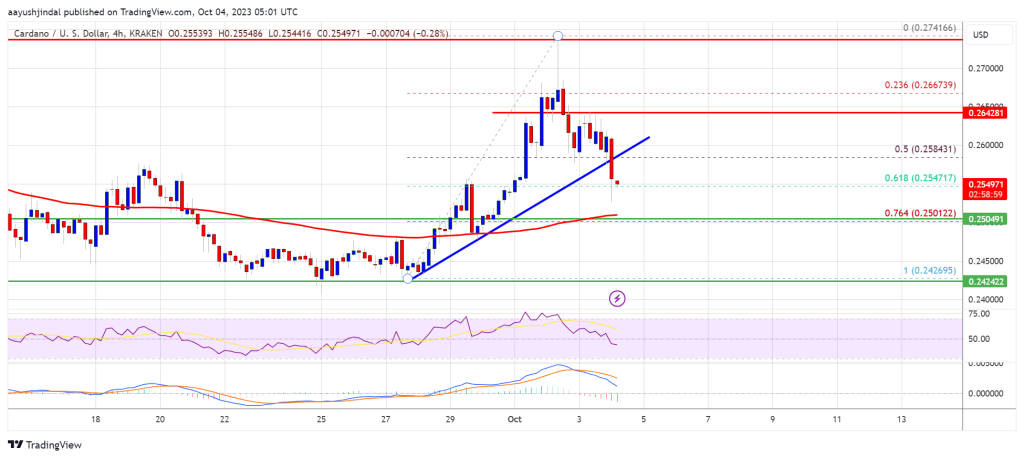
- There was a break below a key bullish trend line with support near $0.258 on the 4-hour chart of the ADA/USD pair (data source from Kraken).
- The pair must stay above the $0.250 support to start a fresh increase in the near term.
In the past few days, Cardano’s price climbed higher above the $0.255 level. The price was able to clear the $0.265 resistance, but the upsides were limited. The price traded as high as $0.2741 and recently corrected lower, like Bitcoin and Ethereum.
There was a drop below the $0.265 support level. Besides, there was a break below a key bullish trend line with support near $0.258 on the 4-hour chart of the ADA/USD pair.
Cardano is now testing the 61.8% Fib retracement level of the upward move from the $0.2426 swing low to the $0.2741 high. However, ADA is still above $0.250 and the 100 simple moving average (4 hours).
Source: ADAUSD on TradingView.com
On the upside, immediate resistance is near the $0.258 zone. The first major resistance is forming near the $0.265 zone. The next key resistance might be $0.274. If there is a close above the $0.274 resistance, the price could start a decent increase. In the stated case, the price could rise toward the $0.300 resistance zone.
More Losses in ADA?If Cardano’s price fails to climb above the $0.265 resistance level, it could continue to move down. Immediate support on the downside is near the $0.250 level.
The next major support is near the $0.242 level. A downside break below the $0.242 level could open the doors for a sharp fresh decline toward $0.220. The next major support is near the $0.200 level.
Technical Indicators
4 hours MACD – The MACD for ADA/USD is gaining momentum in the bearish zone.
4 hours RSI (Relative Strength Index) – The RSI for ADA/USD is now below the 50 level.
Major Support Levels – $0.250, $0.242, and $0.220.
Major Resistance Levels – $0.265, $0.274, and $0.300.
Why this matters
This altcoin story adds another data point to the current market tape and is useful when read alongside nearby source coverage.
Original source
Read on NewsBTCRelated market context

Solana Price Prediction: SOL Holds Near $81 as Breakout Setup Points to $87, but Whale Flows Keep Risk Active
Solana price is back in focus after a sharp recovery pushed SOL towards the $81 area. The move has improved short-term momentum, e...

XRP Price Prediction: SuperTrend Buy Signal Meets Shrinking Supply as $1.24 Breakout Comes Into Focus
After a fresh SuperTrend buy signal appeared on the 4-hour chart, analysts are watching whether the XRP price can extend its recen...

Hyperliquid (HYPE) Price Prediction: Symmetrical Triangle Breakout Puts $77 Target Back in Focus
The breakout comes after several sessions of price compression, with HYPE continuing to trade within a broader technical structure...

JP Morgan Warns of New Bitcoin Sell Pressure From Strategy While XRP AI Transactions Approach 1 Million
Although the two developments are unrelated, they illustrate how Bitcoin’s institutional investment narrative and XRP’s expanding...

Mark Zuckerberg’s Meta AI Predicts Unbelievable Bitcoin Price by the End of 2026
Mark Zuckerberg’s Meta AI predicts and stacks 4 numbered catalysts behind its Bitcoin price prediction that puts $120,000 to $150,...

Bitcoin whales send 49,000 BTC to exchanges as $60K rebound shows signs of weakness
Bitcoin’s recovery above $60,000 is facing a fresh test from exchange-flow and derivatives data after large holders moved one of t...