ADA Price Surges Over 35% In Few Days, Can Bulls Pump Cardano To $1?
Cardano (ADA) is gaining pace above the $0.60 resistance. ADA could rally further if there is a clear move above the $0.685 and $0.700 resistance levels. ADA price is moving higher above the $0.600 pivot level. The price...
Archive context
Older archive item. Useful for background and entity history, but not a fresh market-moving signal.

Cardano (ADA) is gaining pace above the $0.60 resistance. ADA could rally further if there is a clear move above the $0.685 and $0.700 resistance levels.
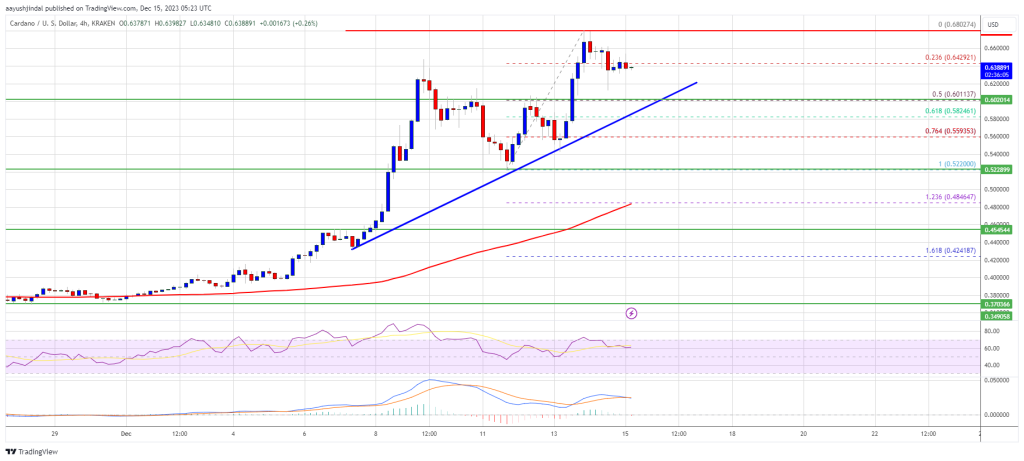
- ADA price is moving higher above the $0.600 pivot level.
- The price is trading above $0.620 and the 100 simple moving average (4 hours).
- There is a key bullish trend line forming with support near $0.6020 on the 4-hour chart of the ADA/USD pair (data source from Kraken).
- The pair could accelerate higher toward the $0.800 level or even $1.00 in the coming weeks.
After forming a base above the $0.500 level, Cardano started a steady increase. There was a break above the $0.550 and $0.600 resistance levels, outperforming Bitcoin and Ethereum.
ADA cleared many hurdles and even spiked above $0.680. A new multi-week high was formed near $0.6802 and the price is now consolidating gains. There was a minor decline below the 23.3% Fib retracement level of the upward move from the $0.5220 swing low to the $0.6802 high.
ADA is now trading above $0.500 and the 100 simple moving average (4 hours). There is also a key bullish trend line forming with support near $0.6020 on the 4-hour chart of the ADA/USD pair. The trend line is close to the 50% Fib retracement level of the upward move from the $0.5220 swing low to the $0.6802 high.
Source: ADAUSD on TradingView.com
On the upside, immediate resistance is near the $0.660 zone. The first resistance is near $0.685. The next key resistance might be $0.700. If there is a close above the $0.700 resistance, the price could start a strong rally. In the stated case, the price could rise toward the $0.80 region. Any more gains might call for a move toward $1.00.
Are Dips Limited in ADA?If Cardano’s price fails to climb above the $0.685 resistance level, it could start a downside correction. Immediate support on the downside is near the $0.6200 level.
The next major support is near the $0.600 level and the trend line. A downside break below the $0.600 level could open the doors for a test of $0.5550. The next major support is near the $0.5220 level.
Technical Indicators
4 hours MACD – The MACD for ADA/USD is losing momentum in the bullish zone.
4 hours RSI (Relative Strength Index) – The RSI for ADA/USD is now above the 50 level.
Major Support Levels – $0.620, $0.600, and $0.555.
Major Resistance Levels – $0.685, $0.700, and $0.800.
Why this matters
This altcoin story adds another data point to the current market tape and is useful when read alongside nearby source coverage.
Original source
Read on NewsBTCRelated market context

XRP Price Prediction: SuperTrend Buy Signal Meets Shrinking Supply as $1.24 Breakout Comes Into Focus
After a fresh SuperTrend buy signal appeared on the 4-hour chart, analysts are watching whether the XRP price can extend its recen...

Bitcoin Price Eyes Recovery After END-OF-CYCLE STRC Shock, Bitwise CIO Says Strategy Will Be ‘Less Important’ Next BTC Cycle
While improving macroeconomic conditions have supported a modest Bitcoin price rebound, Bitwise Chief Investment Officer Matt Houg...

XRP vs Bitcoin: Investor Says RLUSD Growth and Regulatory Clarity Could Shift Crypto’s Balance of Power
While the claim remains highly ambitious given Bitcoin’s commanding lead in market capitalization, the discussion highlights broad...

Mark Zuckerberg’s Meta AI Predicts Unbelievable Bitcoin Price by the End of 2026
Mark Zuckerberg’s Meta AI predicts and stacks 4 numbered catalysts behind its Bitcoin price prediction that puts $120,000 to $150,...

Bitcoin whales send 49,000 BTC to exchanges as $60K rebound shows signs of weakness
Bitcoin’s recovery above $60,000 is facing a fresh test from exchange-flow and derivatives data after large holders moved one of t...

Leading Claude AI Fable 5 Predicts Stunning XRP Price by The End of 2026
Anthropic’s new Claude AI model, Fable 5, predicts XRP price for the entire second half around a single event that could be resolv...