BNB Price At Make-Or-Break Moment, Key Levels To Watch
BNB price struggled to climb above $240 and corrected gains against the US Dollar. It is now approaching a major support zone at $220 and $215. BNB price is slowly moving lower toward the $220 support against the US Doll...
Archive context
Older archive item. Useful for background and entity history, but not a fresh market-moving signal.

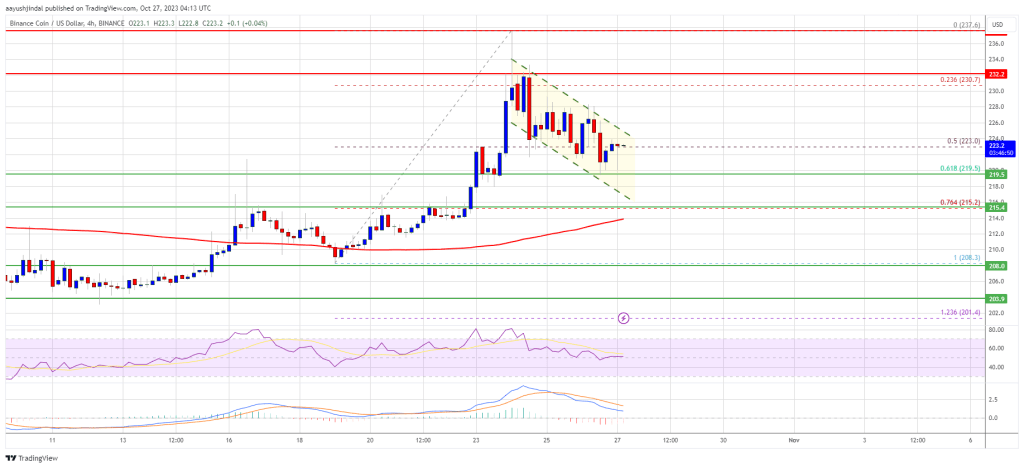
BNB price struggled to climb above $240 and corrected gains against the US Dollar. It is now approaching a major support zone at $220 and $215.
- BNB price is slowly moving lower toward the $220 support against the US Dollar.
- The price is now trading above $215 and the 100 simple moving average (4 hours).
- There is a key bullish flag pattern forming with resistance near $225 on the 4-hour chart of the BNB/USD pair (data source from Binance).
- The pair might gain bullish momentum if there is a clear move above $228.
These past few days, BNB price saw a decent recovery wave above the key $220 resistance zone. Bitcoin rallied over 20% to $35,000 and helped BNB avoid a major downside break.
The price climbed above the $225 and $230 resistance levels. However, it struggled near the $238-$240 zone. A high was formed near $237.6 and the price recently started a downside correction. There was a move below the $235 level.
BNB dipped below the 50% Fib retracement level of the upward move from the $208.3 swing low to the $237.6 high. It is now trading above $215 and the 100 simple moving average (4 hours). There is also a key bullish flag pattern forming with resistance near $225 on the 4-hour chart of the BNB/USD pair.
If there is a fresh increase, the price could face resistance near the $225 level. The next resistance sits near the $228 level. A clear move above the $228 zone could send the price further higher. In the stated case, BNB price could test $238. A close above the $238 resistance might set the pace for a larger increase toward the $250 resistance.
More Losses?If BNB fails to clear the $228 resistance, it could start another decline. Initial support on the downside is near the $220 level and the 61.8% Fib retracement level of the upward move from the $208.3 swing low to the $237.6 high.
The next major support is near the $215 level or the 100 simple moving average (4 hours). If there is a downside break below the $215 support, the price could drop toward the $207 support. Any more losses could initiate a larger decline toward the $202 level.
Technical Indicators
4-Hours MACD – The MACD for BNB/USD is losing pace in the bullish zone.
4-Hours RSI (Relative Strength Index) – The RSI for BNB/USD is currently above the 50 level.
Major Support Levels – $220, $215, and $207.
Major Resistance Levels – $225, $228, and $238.
Why this matters
This altcoin story adds another data point to the current market tape and is useful when read alongside nearby source coverage.
Original source
Read on NewsBTCRelated market context

XRP Price Prediction: SuperTrend Buy Signal Meets Shrinking Supply as $1.24 Breakout Comes Into Focus
After a fresh SuperTrend buy signal appeared on the 4-hour chart, analysts are watching whether the XRP price can extend its recen...

JP Morgan Warns of New Bitcoin Sell Pressure From Strategy While XRP AI Transactions Approach 1 Million
Although the two developments are unrelated, they illustrate how Bitcoin’s institutional investment narrative and XRP’s expanding...

XRP vs Bitcoin: Investor Says RLUSD Growth and Regulatory Clarity Could Shift Crypto’s Balance of Power
While the claim remains highly ambitious given Bitcoin’s commanding lead in market capitalization, the discussion highlights broad...

Bitcoin whales send 49,000 BTC to exchanges as $60K rebound shows signs of weakness
Bitcoin’s recovery above $60,000 is facing a fresh test from exchange-flow and derivatives data after large holders moved one of t...

Fed Schedules $10B Treasury Bill Purchases as Liquidity Move Fuels Crypto Market Optimism
Key Takeaways: The New York Fed will make approximately $10 billion in purchases of Treasury bills from June 12 to July 13. The op...

Vitalik Buterin unveils “Lean Ethereum” roadmap for quantum resistance by 2029
Ethereum's proactive roadmap enhances its resilience and appeal, potentially boosting market confidence and investment in its futu...