BNB Price Breaking This Confluence Resistance Could Spark a Significant Surge
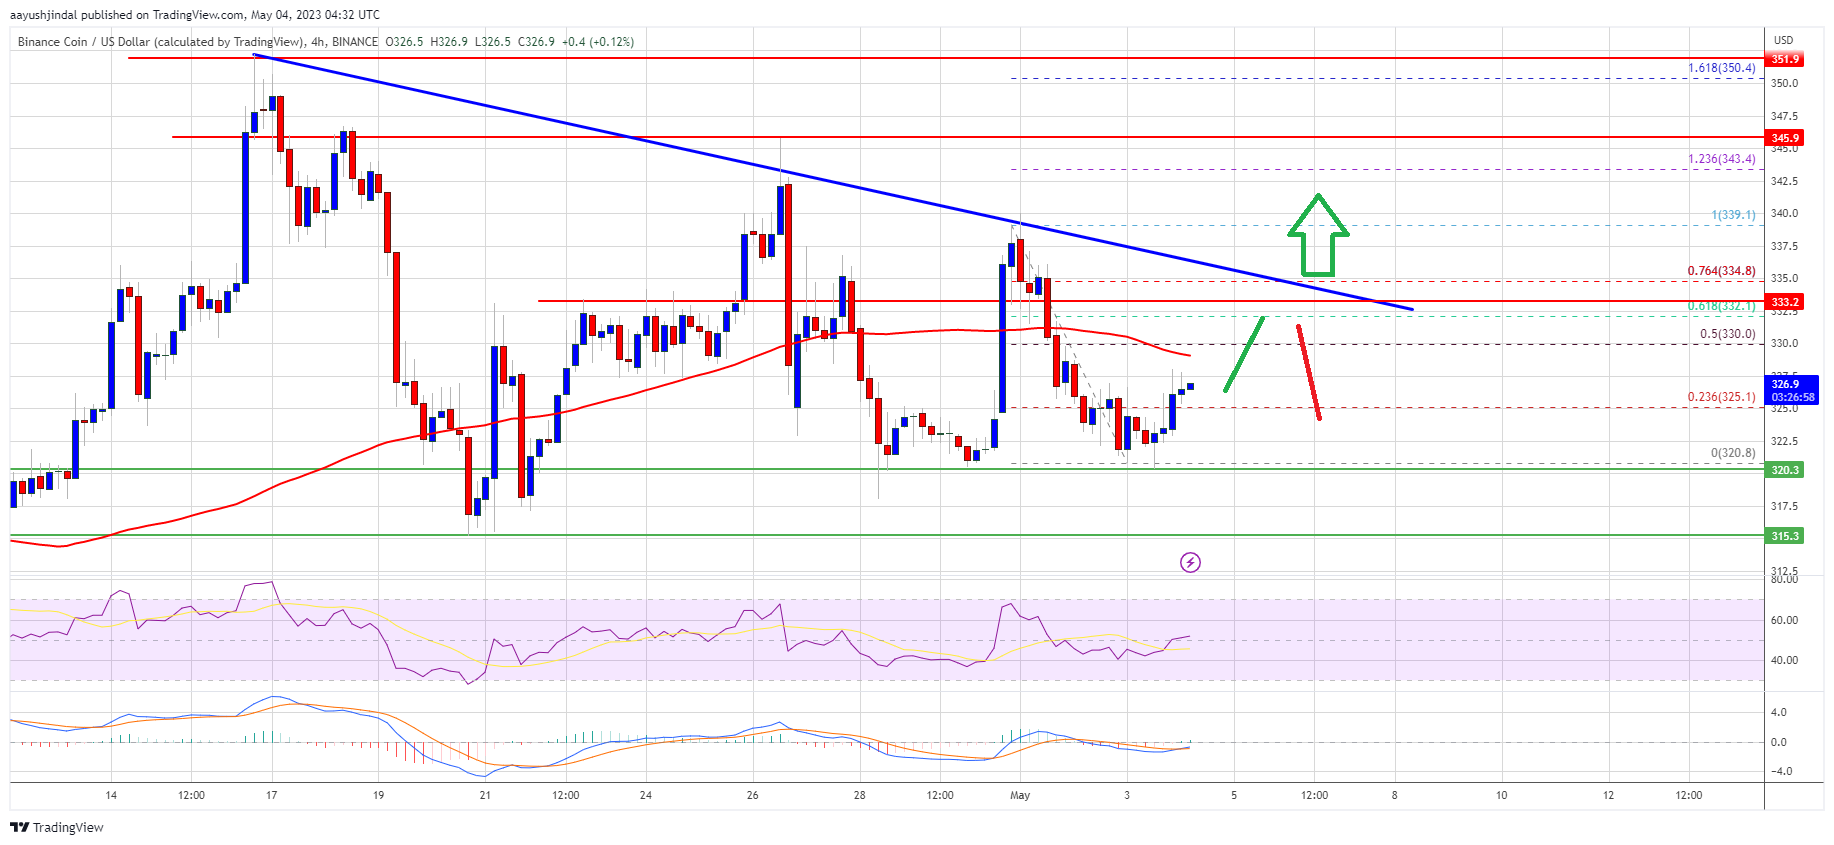
BNB price (Binance coin) is consolidating above the $320 support against the US Dollar. It could start a major increase if there is a break above $335. Binance coin price is trading in a range above $320 resistance again...
Archive context
Older archive item. Useful for background and entity history, but not a fresh market-moving signal.

BNB price (Binance coin) is consolidating above the $320 support against the US Dollar. It could start a major increase if there is a break above $335.
- Binance coin price is trading in a range above $320 resistance against the US Dollar.
- The price is now trading below $330 and the 100 simple moving average (4 hours).
- There is a key bearish trend line forming with resistance near $333 on the 4-hour chart of the BNB/USD pair (data source from Binance).
- The pair could start a fresh increase if it clears $333 and $335.
This past week, BNB price attempted an upside break above the $340 resistance. However, the bulls struggled to gain strength and the price corrected gains, similar to Bitcoin and Ethereum.
There was a move below the $330 support zone and the price tested $320. A low is formed near $320.8 and the price is now consolidating. It is now trading below $330 and the 100 simple moving average (4 hours). There is also a key bearish trend line forming with resistance near $333 on the 4-hour chart of the BNB/USD pair.
On the upside, BNB is facing resistance near the $330 level and the 100 simple moving average (4 hours). It is close to the 50% Fib retracement level of the recent decline from the $339 swing high to the $320 low.
Source: BNBUSD on TradingView.com
The next major resistance is near the trend line or $335 or the 76.4% Fib retracement level of the recent decline from the $339 swing high to the $320 low. A clear move above the $335 resistance might spark bullish moves. The next major resistance is near the $340 level, above which the price might rise toward the $350 resistance. Any more gains might send the price toward the $365 level.
Another Drop in BNB?If BNB fails to clear the $335 resistance, it could continue to move down. Initial support on the downside is near the $320 level.
The next major support is near the $315 level. If there is a downside break below the $315 support, there could be an extended decline toward the $300 support.
Technical Indicators
4-Hours MACD – The MACD for BNB/USD is losing pace in the bearish zone.
4-Hours RSI (Relative Strength Index) – The RSI for BNB/USD is currently above the 50 level.
Major Support Levels – $320, $315, and $300.
Major Resistance Levels – $330, $335, and $345.
Why this matters
This altcoin story adds another data point to the current market tape and is useful when read alongside nearby source coverage.
Original source
Read on NewsBTCRelated market context

Bitcoin (BTC) Price Prediction: BTC Holds $63K Support—Can Rising Active Addresses Offset Bearish Technical Signals?
Although the BTC price has remained near a key support zone, recent chart signals and Strategy’s sale of a portion of its Bitcoin...
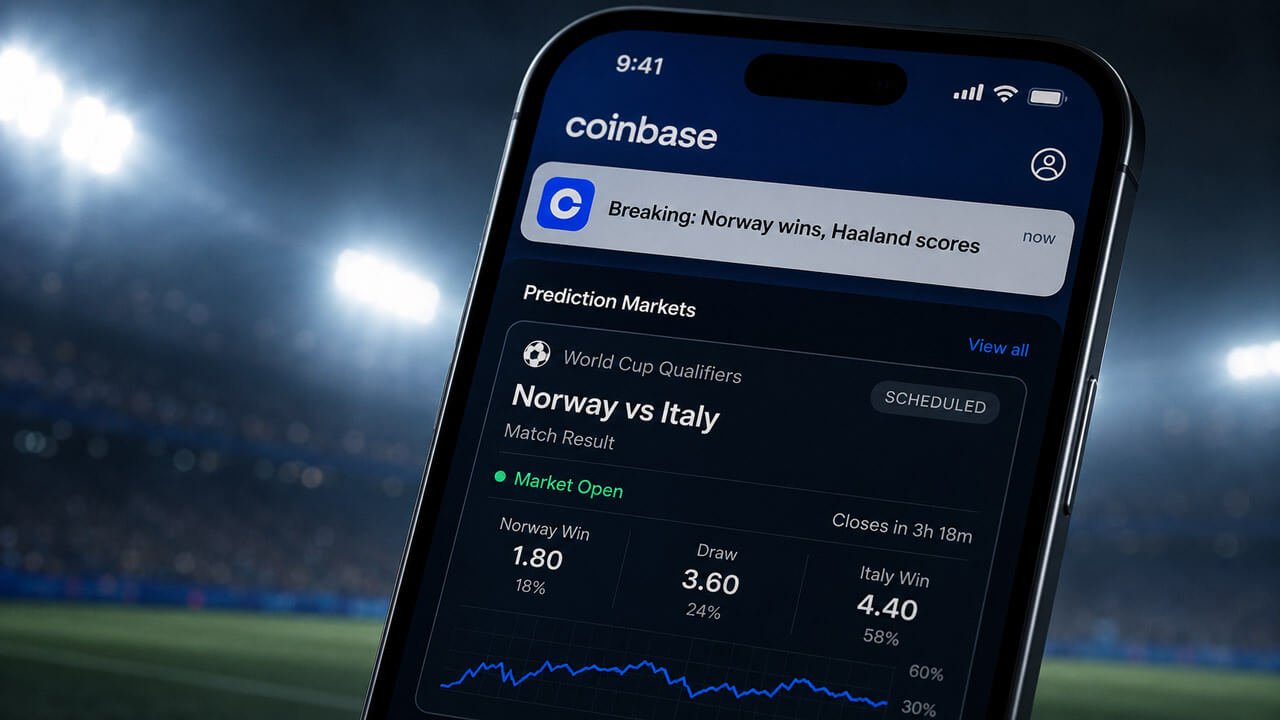
Coinbase World Cup error shows prediction markets still have a proof problem
A reported Coinbase announcement about a World Cup result, likely using AI, created a problem bigger than a flawed alert. It showe...

VanEck Solana ETF Filing Pushes Altcoin Fund Race Beyond Bitcoin And Ethereum
Solana is now formally in the U.S. spot ETF conversation after a VanEck-linked proposal reached the SEC through a Cboe BZX rule fi...
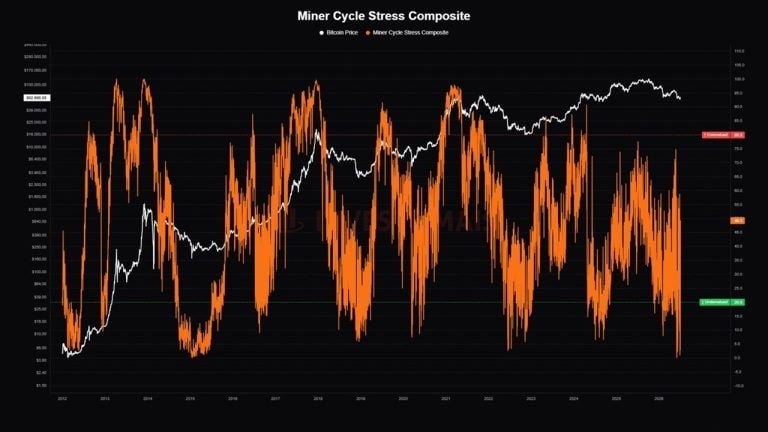
Bitcoin Miner Stress Hits ‘Historically Rare’ Level as 20% of Miners Operate at a Loss
Bitcoin’s Miner Cycle Stress Composite has fallen to a new 2026 low and entered its “undervalued” range, a synchronized decline pr...
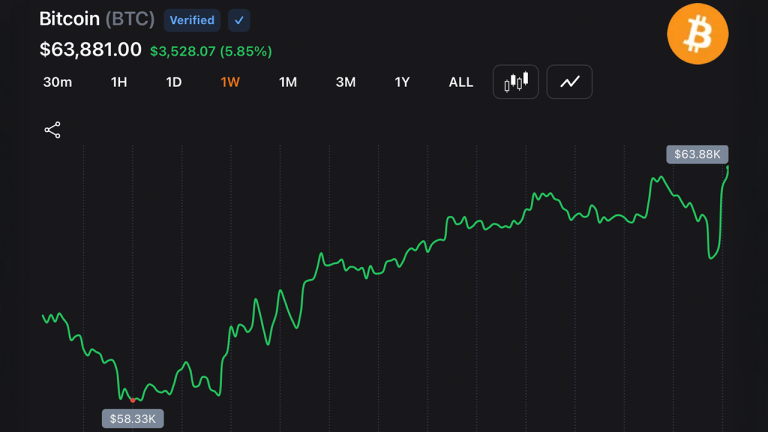
Bitcoin Rebounds Above $63,500 After Strategy’s $216M Sale Triggers $214M in Short Liquidations
Bitcoin nearly reached $64,000 over the weekend before a sharp Monday morning drop dragged it to an intraday low of $61,246. It qu...
USDT Returns to Bitcoin: RGB and UTEXO Enable Private Lightning Settlements
Bitcoin Magazine USDT Returns to Bitcoin: RGB and UTEXO Enable Private Lightning Settlements Tether, the company behind USDT, is p...