BNB Price Momentum Reignites – Why Bulls Could Aim For 15% Rally
BNB price gained momentum and climbed above the $250 resistance. It is up over 5% and the bulls could soon aim for a move toward the $300 level. BNB price is moving higher above the $250 resistance. The price is now trad...
Archive context
Older archive item. Useful for background and entity history, but not a fresh market-moving signal.

BNB price gained momentum and climbed above the $250 resistance. It is up over 5% and the bulls could soon aim for a move toward the $300 level.
- BNB price is moving higher above the $250 resistance.
- The price is now trading above $255 and the 100 simple moving average (4 hours).
- There is a major bullish trend line forming with support at $253.5 on the 4-hour chart of the BNB/USD pair (data source from Binance).
- The pair might continue to move up if there is a clear move above $268.
These past few days, BNB price remained stable above the $240 resistance. The bulls stepped in and were able to clear a major hurdle at $250. It opened the doors for more upsides above $255.
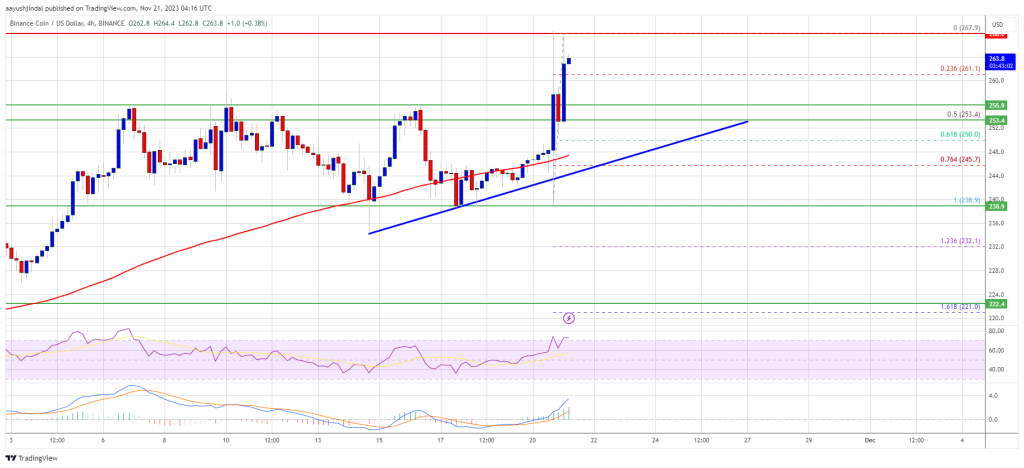
BNB gained traction and climbed above $260. It is up over 5% and outperforming both Bitcoin and Ethereum. A new multi-week high is formed near $267.9 and the price is now consolidating gains. It is above the 23.6% Fib retracement level of the upward move from the $238.9 swing low to the $267.9 high.
BNB is also trading above $255 and the 100 simple moving average (4 hours). Besides, there is a major bullish trend line forming with support at $253.5 on the 4-hour chart of the BNB/USD pair.
Source: BNBUSD on TradingView.com
If there is a fresh increase, the price could face resistance near the $265 level. The next resistance sits near the $268 level. A clear move above the $268 zone could send the price further higher. In the stated case, BNB price could test $280. A close above the $280 resistance might set the pace for a larger increase toward the $300 resistance.
Downside Correction?If BNB fails to clear the $265 resistance, it could start a downside correction. Initial support on the downside is near the $260 level. The next major support is near the $255 level.
The main support sits at $253 or the trend line. It is close to the 50% Fib retracement level of the upward move from the $238.9 swing low to the $267.9 high. If there is a downside break below the $253 support, the price could drop toward the $245 support. Any more losses could initiate a larger decline toward the $238 level.
Technical Indicators
4-Hours MACD – The MACD for BNB/USD is gaining pace in the bullish zone.
4-Hours RSI (Relative Strength Index) – The RSI for BNB/USD is currently above the 50 level.
Major Support Levels – $260, $255, and $253.
Major Resistance Levels – $265, $268, and $280.
Why this matters
This altcoin story adds another data point to the current market tape and is useful when read alongside nearby source coverage.
Original source
Read on NewsBTCRelated market context

Bitcoin Rebounds Toward $63,000, But ETF Flows Still Hold The Key
Bitcoin has started the new week with a little more colour on the screen. After sliding through the kind of levels that usually tr...

Mark Zuckerberg’s Meta AI Predicts Unbelievable Bitcoin Price by the End of 2026
Mark Zuckerberg’s Meta AI predicts and stacks 4 numbered catalysts behind its Bitcoin price prediction that puts $120,000 to $150,...

XRP vs Bitcoin: Investor Says RLUSD Growth and Regulatory Clarity Could Shift Crypto’s Balance of Power
While the claim remains highly ambitious given Bitcoin’s commanding lead in market capitalization, the discussion highlights broad...

XRP Price Prediction: SuperTrend Buy Signal Meets Shrinking Supply as $1.24 Breakout Comes Into Focus
After a fresh SuperTrend buy signal appeared on the 4-hour chart, analysts are watching whether the XRP price can extend its recen...

Bitcoin whales send 49,000 BTC to exchanges as $60K rebound shows signs of weakness
Bitcoin’s recovery above $60,000 is facing a fresh test from exchange-flow and derivatives data after large holders moved one of t...

Vitalik Buterin unveils “Lean Ethereum” roadmap for quantum resistance by 2029
Ethereum's proactive roadmap enhances its resilience and appeal, potentially boosting market confidence and investment in its futu...