BNB Price Prediction – Bears Struggle, Will Price Finally Cross $220?
BNB price is still consolidating above the $200 support zone against the US Dollar. It could start a decent increase if there is a close above the $220 resistance. BNB price is slowly moving higher toward the $220 resist...
Archive context
Older archive item. Useful for background and entity history, but not a fresh market-moving signal.

BNB price is still consolidating above the $200 support zone against the US Dollar. It could start a decent increase if there is a close above the $220 resistance.
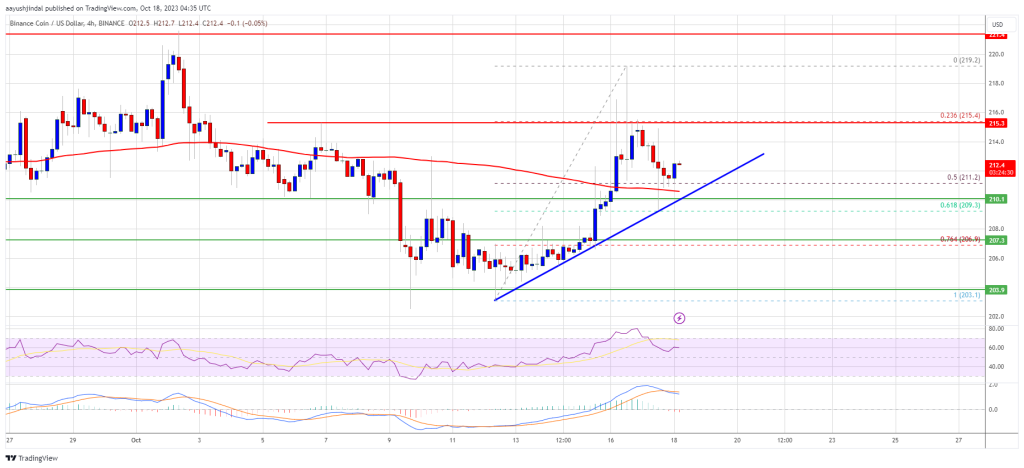
- BNB price is slowly moving higher toward the $220 resistance against the US Dollar.
- The price is now trading above $210 and the 100 simple moving average (4 hours).
- There is a key bullish trend line forming with support near $211.5 on the 4-hour chart of the BNB/USD pair (data source from Binance).
- The pair might gain bullish momentum if there is a daily close above $220.
This past week, BNB price again retested the $200-$202 support zone. The bears made another attempt to clear the key $200 support, but they failed. A low was formed near $203 before the price started a decent increase, like Bitcoin and Ethereum.
There was a move above the $210 and $212 levels. The price tested the main $220 resistance. A high is formed near $219.2 and the price is now consolidating above the 50% Fib retracement level of the upward move from the $203 swing low to the $220 high.
BNB is now trading above $210 and the 100 simple moving average (4 hours). There is also a key bullish trend line forming with support near $211.5 on the 4-hour chart of the BNB/USD pair.
Source: BNBUSD on TradingView.com
If there is a fresh increase, the price could face resistance near the $215.5 level. The next resistance sits near the $220 level. A clear move above the $220 zone could send the price further higher. In the stated case, BNB price could test $235. A close above the $235 resistance might set the pace for a larger increase toward the $250 resistance.
More Losses?If BNB fails to clear the $220 resistance, it could start another decline. Initial support on the downside is near the $211 level and the trend line. The next major support is near the $207 level or the 76.4% Fib retracement level of the upward move from the $203 swing low to the $220 high.
If there is a downside break below the $207 support, the price could drop toward the $202 support. Any more losses could initiate a larger decline toward the $185 level.
Technical Indicators
4-Hours MACD – The MACD for BNB/USD is losing pace in the bearish zone.
4-Hours RSI (Relative Strength Index) – The RSI for BNB/USD is currently above the 50 level.
Major Support Levels – $211, $207, and $202.
Major Resistance Levels – $215, $220, and $222.
Why this matters
This altcoin story adds another data point to the current market tape and is useful when read alongside nearby source coverage.
Original source
Read on NewsBTCRelated market context

Solana Price Prediction: SOL Holds Near $81 as Breakout Setup Points to $87, but Whale Flows Keep Risk Active
Solana price is back in focus after a sharp recovery pushed SOL towards the $81 area. The move has improved short-term momentum, e...

Hyperliquid (HYPE) Price Prediction: Symmetrical Triangle Breakout Puts $77 Target Back in Focus
The breakout comes after several sessions of price compression, with HYPE continuing to trade within a broader technical structure...

JP Morgan Warns of New Bitcoin Sell Pressure From Strategy While XRP AI Transactions Approach 1 Million
Although the two developments are unrelated, they illustrate how Bitcoin’s institutional investment narrative and XRP’s expanding...

Bitcoin Rebounds Toward $63,000, But ETF Flows Still Hold The Key
Bitcoin has started the new week with a little more colour on the screen. After sliding through the kind of levels that usually tr...

XRP vs Bitcoin: Investor Says RLUSD Growth and Regulatory Clarity Could Shift Crypto’s Balance of Power
While the claim remains highly ambitious given Bitcoin’s commanding lead in market capitalization, the discussion highlights broad...

XRP Price Prediction: SuperTrend Buy Signal Meets Shrinking Supply as $1.24 Breakout Comes Into Focus
After a fresh SuperTrend buy signal appeared on the 4-hour chart, analysts are watching whether the XRP price can extend its recen...