BNB Price Prediction: Breaking This Barrier Could Spark a Significant Surge
BNB price (Binance coin) found support near $255 against the US Dollar. BNB is rising and might gain pace if it clears the $285 resistance zone. Binance coin price started a recovery wave from the $255 support against th...

BNB price (Binance coin) found support near $255 against the US Dollar. BNB is rising and might gain pace if it clears the $285 resistance zone.
- Binance coin price started a recovery wave from the $255 support against the US Dollar.
- The price is now trading below $280 and the 100 simple moving average (4-hours).
- There is a major bearish trend line forming with resistance near $285 on the 4-hours chart of the BNB/USD pair (data source from Binance).
- The pair could start a fresh rally if it clears the $285 and $290 levels.
After a steady decline, BNB price settled below the $280 level. It tested the $255 support zone and traded as low as $253.8. Recently, there was a recovery wave above the $260 level, similar to bitcoin and ethereum.
The price climbed above the $265 and $268 resistance levels. There was a clear move above the 23.6% Fib retracement level of the main decline from the $317 swing high to $253 swing low. However, bnb price is still trading below $280 and the 100 simple moving average (4-hours).
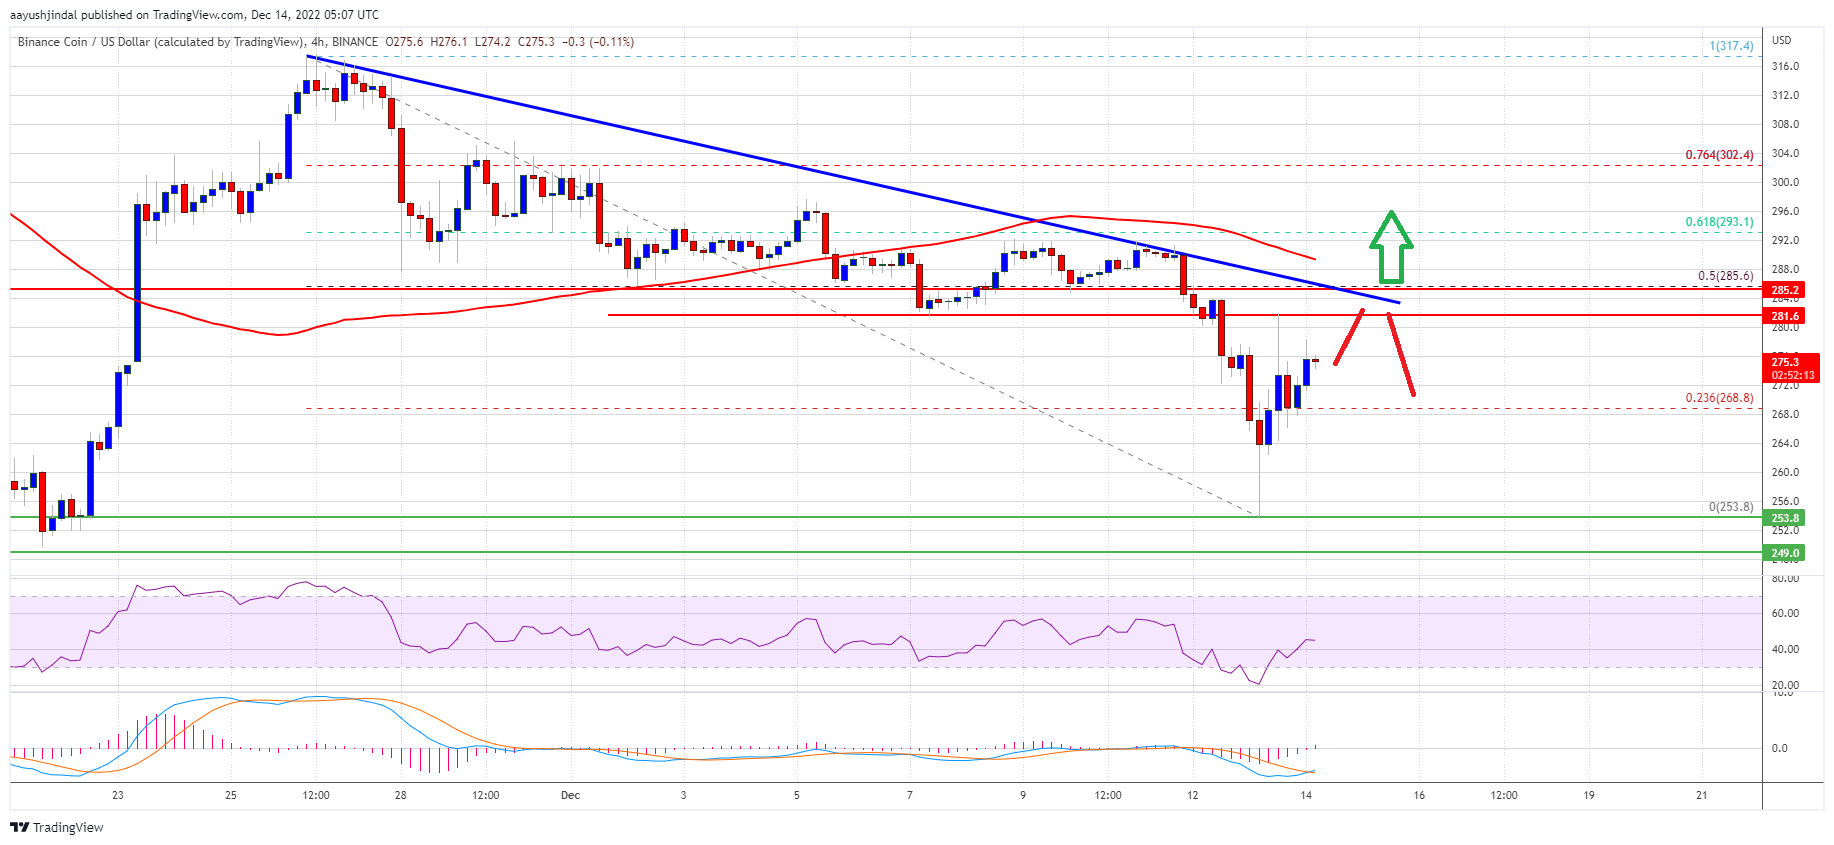
On the upside, the $280 and $285 levels are immediate hurdles. There is also a major bearish trend line forming with resistance near $285 on the 4-hours chart of the BNB/USD pair.
Source: BNBUSD on TradingView.com
The 50% Fib retracement level of the main decline from the $317 swing high to $253 swing low is also near $285. The next major resistance is near the $290 level, above which the price is likely to aim a test of the $320 level in the near term. Any more gains might send the price towards the $350 level.
Fresh Decline in BNB?If BNB fails to clear the $285 resistance, it could start a fresh decline. An initial support on the downside is near the $268 and $265 levels.
The first major support is near the $260 level. The next major support is near the $255 level. If there is a downside break below the $255 support, there could be an extended decline towards the $225 support.
Technical Indicators
4-Hours MACD – The MACD for BNB/USD is gaining pace in the bullish zone.
4-Hours RSI (Relative Strength Index) – The RSI for BNB/USD is currently near the 50 level.
Major Support Levels – $265, $260 and $255.
Major Resistance Levels – $285, $290 and $320.
Original source
Read on NewsBTCRelated market context

Bitcoin price faces new risk as big buyers lose conviction
Bitcoin’s largest buyers are no longer behaving like a reliable backstop for the largest cryptocurrency. The exchange-traded funds...

SpaceX-linked products see $9B in trading, $5.6B on Binance in 24 hours
The surge in SpaceX-linked crypto trading highlights the growing role of digital assets as a parallel financial market, influencin...

Bitcoin rises above $64,000 after Pakistan prime minister says Iran peace deal is near
Bitcoin traded above $64,000 on Saturday, supported by its strongest ETF inflows in a month and growing optimism around geopolitic...

Standard Chartered Says Bitcoin Bottomed Near $59,000 As Crypto Winter Ends
TL;DR Standard Chartered’s Geoffrey Kendrick reportedly says Bitcoin’s $59,000 area marked the cycle bottom. The note cites SpaceX...

US forces shoot down Iranian attack drones near Strait of Hormuz, Bitcoin drops below $73K
Geopolitical tensions near vital oil routes can destabilize financial markets, highlighting the interconnectedness of global secur...

XRP aims for $0.90 as ETF demand battles selling pressure from whales
XRP is trading at $1.11, down roughly 17% from its June opening, having set a new 2026 low on June 5 and shed $8 billion in market...