BNB Price Prediction: Indicators Suggest Strong Case For Rally To $320
BNB price (Binance coin) found support near $250 against the US Dollar. BNB is rising and might gain pace if it clears the $300 resistance zone. Binance coin price started a recovery wave from the $250 support against th...

BNB price (Binance coin) found support near $250 against the US Dollar. BNB is rising and might gain pace if it clears the $300 resistance zone.
- Binance coin price started a recovery wave from the $250 support against the US Dollar.
- The price is now trading above $280 and the 100 simple moving average (4-hours).
- There was a break above a major bearish trend line with resistance near $262 on the 4-hours chart of the BNB/USD pair (data source from Binance).
- The pair could continue to rally if it clears the $295 and $300 levels.
After a strong decline, BNB price even settled below the $300 level. It tested the $250 support zone and traded as low as $249.7. The bulls took a stand near $250 and the price started a recovery wave, similar to bitcoin and ethereum.
The price climbed above the $265 and $270 resistance levels. There was a clear move above the 23.6% Fib retracement level of the downward move from the $361 swing high to $249 swing low.
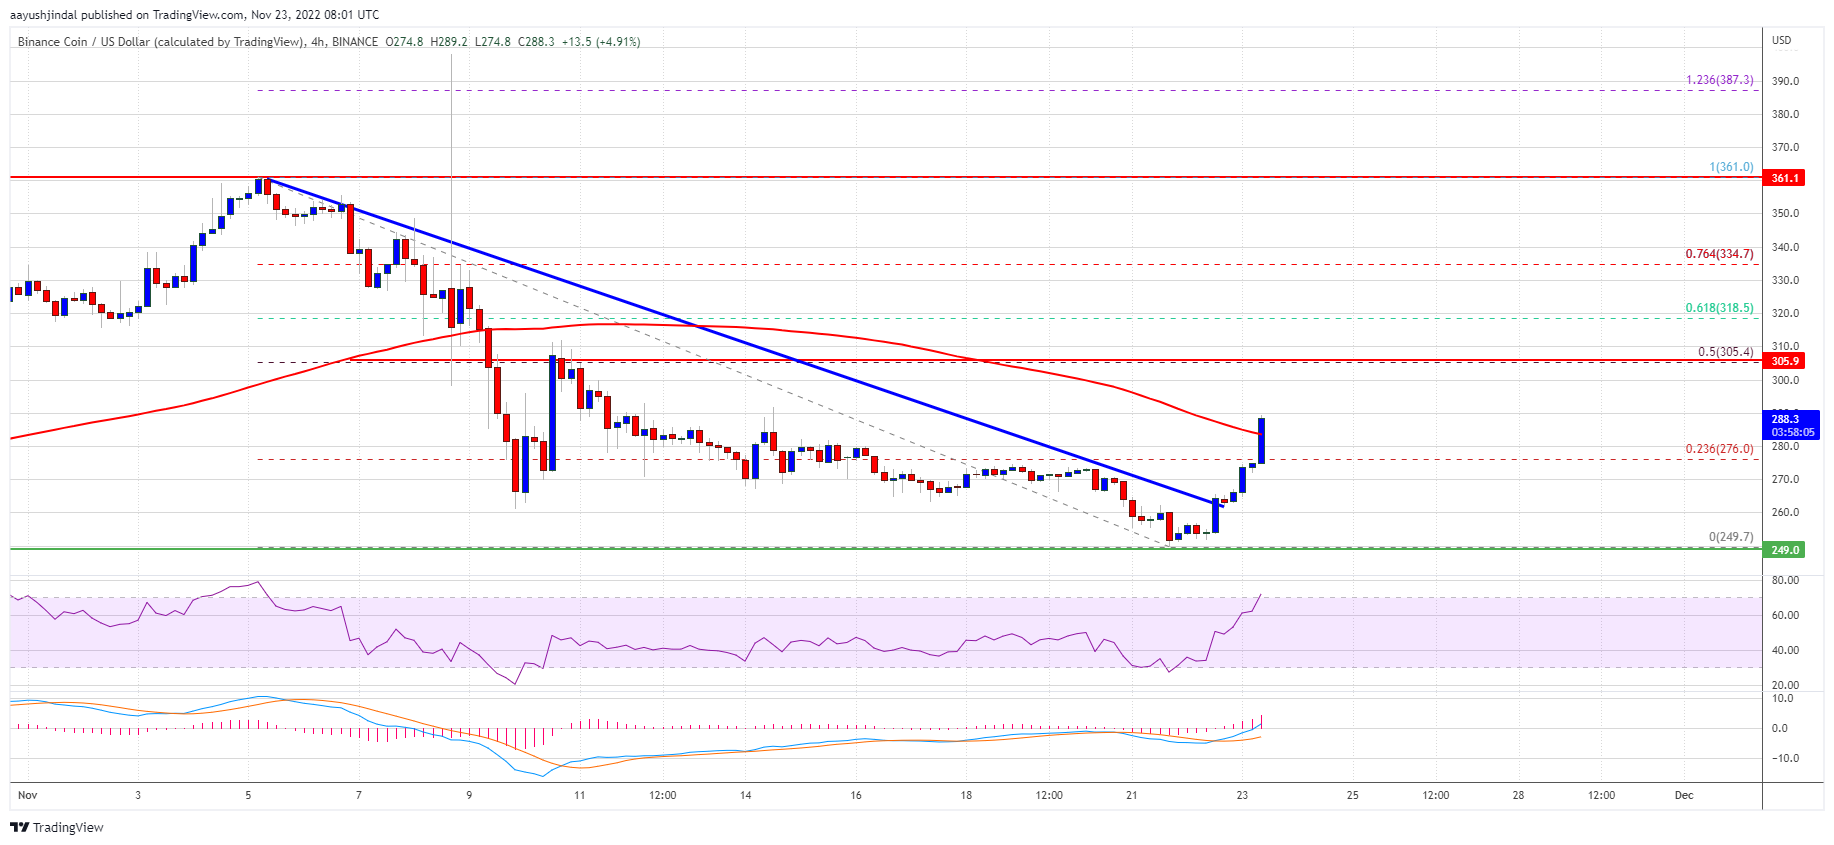
Besides, there was a break above a major bearish trend line with resistance near $262 on the 4-hours chart of the BNB/USD pair. The pair is now trading above $280 and the 100 simple moving average (4-hours).
Source: BNBUSD on TradingView.com
On the upside, the $295 and $300 levels are immediate hurdles. The 50% Fib retracement level of the downward move from the $361 swing high to $249 swing low is also near $305. The next major resistance is near the $320 level, above which the price is likely to aim a test of the $345 level in the near term. Any more gains might send the price towards the $360 level.
Fresh Decline in BNB?If BNB fails to clear the $300 resistance, it could start a fresh decline. An initial support on the downside is near the $280 level and the 100 simple moving average (4-hours).
The first major support is near the $270 level. The next major support is near the $250 level. If there is a downside break below the $250 support, there could be an extended decline towards the $220 support.
Technical Indicators
4-Hours MACD – The MACD for BNB/USD is gaining pace in the bullish zone.
4-Hours RSI (Relative Strength Index) – The RSI for BNB/USD is currently above the 50 level.
Major Support Levels – $280, $270 and $260.
Major Resistance Levels – $300, $305 and $320.
Original source
Read on NewsBTCRelated market context

Bitcoin price faces new risk as big buyers lose conviction
Bitcoin’s largest buyers are no longer behaving like a reliable backstop for the largest cryptocurrency. The exchange-traded funds...

SpaceX-linked products see $9B in trading, $5.6B on Binance in 24 hours
The surge in SpaceX-linked crypto trading highlights the growing role of digital assets as a parallel financial market, influencin...

Bitcoin rises above $64,000 after Pakistan prime minister says Iran peace deal is near
Bitcoin traded above $64,000 on Saturday, supported by its strongest ETF inflows in a month and growing optimism around geopolitic...

Standard Chartered Says Bitcoin Bottomed Near $59,000 As Crypto Winter Ends
TL;DR Standard Chartered’s Geoffrey Kendrick reportedly says Bitcoin’s $59,000 area marked the cycle bottom. The note cites SpaceX...

XRP aims for $0.90 as ETF demand battles selling pressure from whales
XRP is trading at $1.11, down roughly 17% from its June opening, having set a new 2026 low on June 5 and shed $8 billion in market...

Bitcoin Mining Cost Model Points To $47,000 Floor, But Analysts Urge Caution
TL;DR Crypto Rover says Bitcoin has never bottomed below electrical production cost, currently estimated at $47,000. Mining-cost m...