BNB Price Reclaims $500: Can Bulls Maintain the Push?
BNB price started a fresh increase and cleared the $500 pivot zone. The price is now consolidating gains and might aim for more gains above $525. BNB price started a fresh increase above the $500 resistance zone. The pri...

BNB price started a fresh increase and cleared the $500 pivot zone. The price is now consolidating gains and might aim for more gains above $525.
- BNB price started a fresh increase above the $500 resistance zone.
- The price is now trading below $510 and the 100-hourly simple moving average.
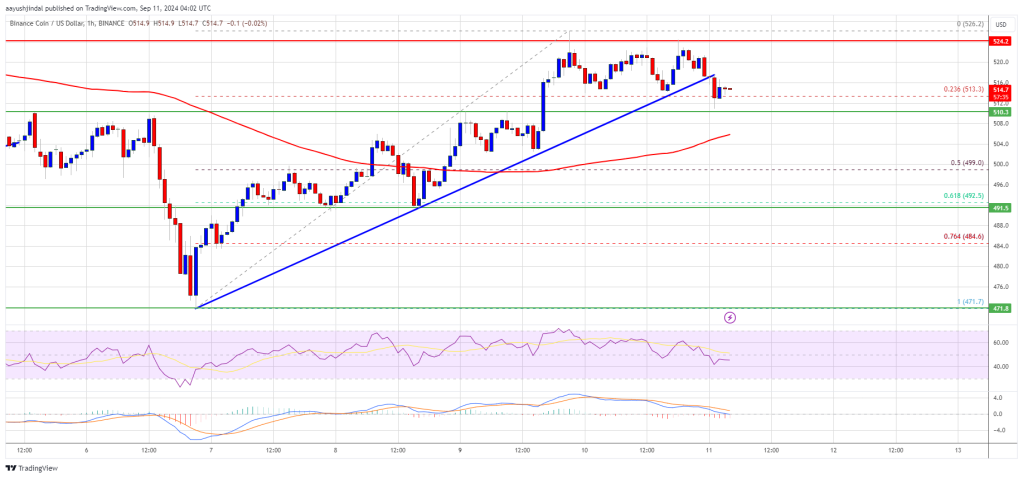
- There was a break below a key bullish trend line with support at $517 on the hourly chart of the BNB/USD pair (data source from Binance).
- The pair must stay above the $500 pivot level to start another increase in the near term.
After forming a base above the $470 level, BNB price started a fresh increase like Ethereum and Bitcoin. The price was able to climb above the $488 and $500 resistance levels.
It even cleared the $515 level and tested $525. A high was formed at $526 and the price started a downside correction. There was a move below the $520 level. The price slipped just below the 23.6% Fib retracement level of the upward move from the $471 swing low to the $526 high.
Besides, there was a break below a key bullish trend line with support at $517 on the hourly chart of the BNB/USD pair. The pair is now trading above $510 and the 100-hourly simple moving average.
If there is a fresh increase, the price could face resistance near the $518 level. The next resistance sits near the $525 level. A clear move above the $525 zone could send the price higher. In the stated case, BNB price could test $535.
A close above the $535 resistance might set the pace for a larger move toward the $550 resistance. Any more gains might call for a test of the $562 level in the near term.
Another Decline?If BNB fails to clear the $525 resistance, it could start another decline. Initial support on the downside is near the $510 level. The next major support is near the $500 level.
The main support sits at $492. If there is a downside break below the $492 support, the price could drop toward the $470 support. Any more losses could initiate a larger decline toward the $450 level.
Technical Indicators
Hourly MACD – The MACD for BNB/USD is losing pace in the bullish zone.
Hourly RSI (Relative Strength Index) – The RSI for BNB/USD is currently above the 50 level.
Major Support Levels – $510 and $500.
Major Resistance Levels – $518 and $525.
Original source
Read on NewsBTCRelated market context

Standard Chartered Says Bitcoin Bottomed Near $59,000 As Crypto Winter Ends
TL;DR Standard Chartered’s Geoffrey Kendrick reportedly says Bitcoin’s $59,000 area marked the cycle bottom. The note cites SpaceX...

Ethereum Price Prediction: 3 Million ETH Rushes Into Staking as Sellers Vanish
Is nobody leaving Ethereum? A record 36 million ETH is now locked in staking, roughly 29–30% of the circulating supply, and the va...

Bitcoin price challenges $64,000 weekend wall – needing a breakout or risk a deeper correction
Bitcoin reclaimed $64,000 on June 12 and touched an intraday high of $64,301 in the same session that spot ETF flows finally flipp...

Bitcoin Mining Cost Model Points To $47,000 Floor, But Analysts Urge Caution
TL;DR Crypto Rover says Bitcoin has never bottomed below electrical production cost, currently estimated at $47,000. Mining-cost m...

Bitcoin rises above $64,000 after Pakistan prime minister says Iran peace deal is near
Bitcoin traded above $64,000 on Saturday, supported by its strongest ETF inflows in a month and growing optimism around geopolitic...

US forces shoot down Iranian attack drones near Strait of Hormuz, Bitcoin drops below $73K
Geopolitical tensions near vital oil routes can destabilize financial markets, highlighting the interconnectedness of global secur...