BNB Price Recovery Faces Setbacks: What Risks Lie Ahead?
BNB price is recovering higher from the $400 support zone. The price is now facing hurdles at $490 and might remain at risk of another decline. BNB price started a recovery wave from the $400 support zone. The price is n...

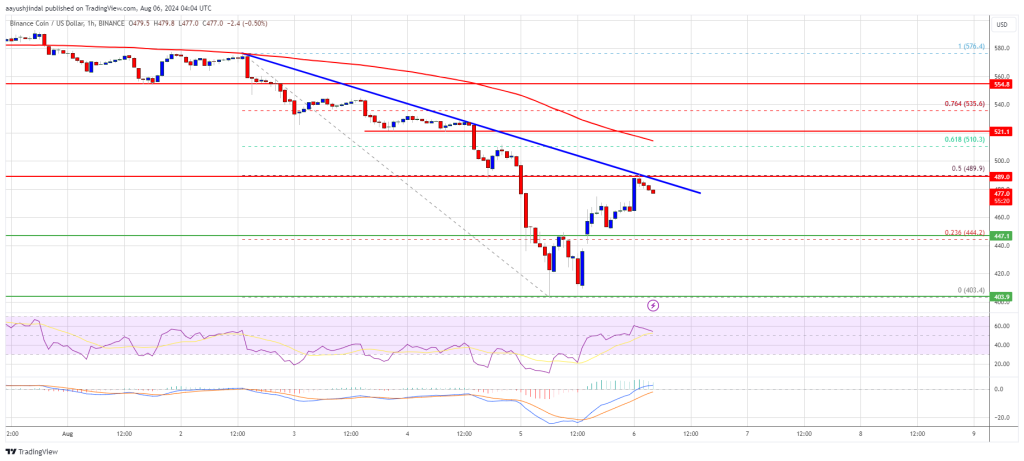
BNB price is recovering higher from the $400 support zone. The price is now facing hurdles at $490 and might remain at risk of another decline.
- BNB price started a recovery wave from the $400 support zone.
- The price is now trading below $500 and the 100-hourly simple moving average.
- There is a key bearish trend line forming with resistance at $490 on the hourly chart of the BNB/USD pair (data source from Binance).
- The pair could start another decline if it fails to clear the $490-$500 resistance zone.
In the past few days, BNB price gained bearish momentum below $500 like Ethereum and Bitcoin. The price declined below the $450 and $435 support levels before the bulls emerged.
A low was formed at $403 and recently started a recovery wave. The price climbed above the $435 and $440 resistance levels. There was a move above the 23.6% Fib retracement level of the downward move from the $576 swing high to the $403 low.
It even cleared the $465 resistance. The price is now trading below $500 and the 100-hourly simple moving average. It is now consolidating near the 50% Fib retracement level of the downward move from the $576 swing high to the $403 low.
On the upside, the price could face resistance near the $490 level. There is also a key bearish trend line forming with resistance at $490 on the hourly chart of the BNB/USD pair.
The next resistance sits near the $500 level. A clear move above the $500 zone could send the price higher. In the stated case, BNB price could test $515. A close above the $515 resistance might set the pace for a larger increase toward the $540 resistance. Any more gains might call for a test of the $550 level in the near term.
Another Decline?If BNB fails to clear the $500 resistance, it could start another decline. Initial support on the downside is near the $465 level. The next major support is near the $450 level.
The main support sits at $435. If there is a downside break below the $435 support, the price could drop toward the $420 support. Any more losses could initiate a larger decline toward the $400 level.
Technical Indicators
Hourly MACD – The MACD for BNB/USD is losing pace in the bullish zone.
Hourly RSI (Relative Strength Index) – The RSI for BNB/USD is currently above the 50 level.
Major Support Levels – $465 and $450.
Major Resistance Levels – $490 and $500.
Original source
Read on NewsBTCRelated market context

Ethereum Price Prediction: 3 Million ETH Rushes Into Staking as Sellers Vanish
Is nobody leaving Ethereum? A record 36 million ETH is now locked in staking, roughly 29–30% of the circulating supply, and the va...

Standard Chartered Says Bitcoin Bottomed Near $59,000 As Crypto Winter Ends
TL;DR Standard Chartered’s Geoffrey Kendrick reportedly says Bitcoin’s $59,000 area marked the cycle bottom. The note cites SpaceX...

Bitcoin price faces new risk as big buyers lose conviction
Bitcoin’s largest buyers are no longer behaving like a reliable backstop for the largest cryptocurrency. The exchange-traded funds...

Bitcoin rises above $64,000 after Pakistan prime minister says Iran peace deal is near
Bitcoin traded above $64,000 on Saturday, supported by its strongest ETF inflows in a month and growing optimism around geopolitic...

Bitcoin faces one of its biggest mining difficulty drops as miner margins collapse
The Bitcoin network is poised to execute one of the largest downward adjustments to its mining difficulty in its 17-year history t...

US forces shoot down Iranian attack drones near Strait of Hormuz, Bitcoin drops below $73K
Geopolitical tensions near vital oil routes can destabilize financial markets, highlighting the interconnectedness of global secur...