BNB Price Shows Signs of Life But $250 Is The Key To More Upsides
BNB price avoided a major decline below $200 and recovered against the US Dollar. It climbed above $235 and now faces many hurdles near $245 and $250. BNB price is slowly moving higher toward the $250 resistance. The pri...
Archive context
Older archive item. Useful for background and entity history, but not a fresh market-moving signal.

BNB price avoided a major decline below $200 and recovered against the US Dollar. It climbed above $235 and now faces many hurdles near $245 and $250.
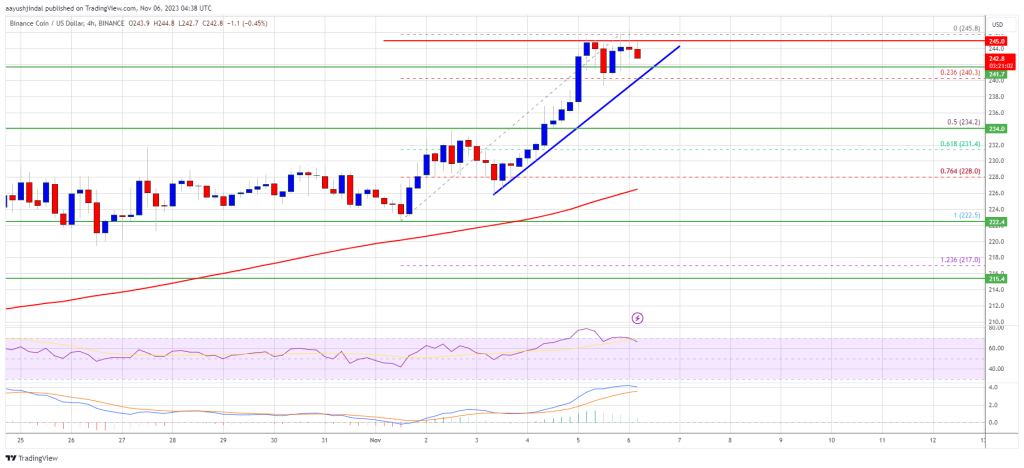
- BNB price is slowly moving higher toward the $250 resistance.
- The price is now trading above $235 and the 100 simple moving average (4 hours).
- There is a key bullish trend line forming with support at $241.5 on the 4-hour chart of the BNB/USD pair (data source from Binance).
- The pair might gain bullish momentum if there is a clear move above $250.
These past few days, BNB price managed to start a recovery wave above the $220 resistance. The recent positive moves in Bitcoin, Ethereum, and other altcoins sparked a decent increase in BNB.
There was a steady move above the $232 and $235 resistance levels. The price even climbed toward the $245 resistance. A high is formed near $245.8 and the price is now consolidating gains. It is trading above the 23.6% Fib retracement level of the upward move from the $222.5 swing low to the $245.8 high.
BNB is also trading above $235 and the 100 simple moving average (4 hours). Besides, there is a key bullish trend line forming with support at $241.5 on the 4-hour chart of the BNB/USD pair.
Source: BNBUSD on TradingView.com
If there is a fresh increase, the price could face resistance near the $245 level. The next resistance sits near the $250 level. A clear move above the $250 zone could send the price further higher. In the stated case, BNB price could test $265. A close above the $265 resistance might set the pace for a larger increase toward the $280 resistance.
Downside Correction?If BNB fails to clear the $245 resistance, it could start a downside correction. Initial support on the downside is near the $240 level and the trend line.
The next major support is near the $235 level or 50% Fib retracement level of the upward move from the $222.5 swing low to the $245.8 high. If there is a downside break below the $235 support, the price could drop toward the $226 support. Any more losses could initiate a larger decline toward the $220 level.
Technical Indicators
4-Hours MACD – The MACD for BNB/USD is losing pace in the bullish zone.
4-Hours RSI (Relative Strength Index) – The RSI for BNB/USD is currently above the 50 level.
Major Support Levels – $240, $235, and $226.
Major Resistance Levels – $245, $250, and $265.
Why this matters
This altcoin story adds another data point to the current market tape and is useful when read alongside nearby source coverage.
Original source
Read on NewsBTCRelated market context

JP Morgan Warns of New Bitcoin Sell Pressure From Strategy While XRP AI Transactions Approach 1 Million
Although the two developments are unrelated, they illustrate how Bitcoin’s institutional investment narrative and XRP’s expanding...

Bitcoin Rebounds Toward $63,000, But ETF Flows Still Hold The Key
Bitcoin has started the new week with a little more colour on the screen. After sliding through the kind of levels that usually tr...

XRP vs Bitcoin: Investor Says RLUSD Growth and Regulatory Clarity Could Shift Crypto’s Balance of Power
While the claim remains highly ambitious given Bitcoin’s commanding lead in market capitalization, the discussion highlights broad...

XRP Price Prediction: SuperTrend Buy Signal Meets Shrinking Supply as $1.24 Breakout Comes Into Focus
After a fresh SuperTrend buy signal appeared on the 4-hour chart, analysts are watching whether the XRP price can extend its recen...

Mark Zuckerberg’s Meta AI Predicts Unbelievable Bitcoin Price by the End of 2026
Mark Zuckerberg’s Meta AI predicts and stacks 4 numbered catalysts behind its Bitcoin price prediction that puts $120,000 to $150,...

Bitcoin whales send 49,000 BTC to exchanges as $60K rebound shows signs of weakness
Bitcoin’s recovery above $60,000 is facing a fresh test from exchange-flow and derivatives data after large holders moved one of t...