Breakout or Breakdown? XRP $2.35 Test Could Decide Its Next Move
XRP is showing mixed signals across timeframes, leaving traders on edge as the price approaches the key $2.35 level. While a recent breakout from a falling wedge on the 3-day chart suggests a bullish reversal, the 4-hour...
Archive context
Older archive item. Useful for background and entity history, but not a fresh market-moving signal.

XRP is showing mixed signals across timeframes, leaving traders on edge as the price approaches the key $2.35 level. While a recent breakout from a falling wedge on the 3-day chart suggests a bullish reversal, the 4-hour chart reveals signs of slowing momentum and a possible rising wedge. With buyers and sellers locked in a battle, $2.35 could be the tipping point that decides whether XRP surges higher or slips into a near-term correction.
XRP Breaks Out Of Falling Wedge On 3-Day ChartIn an X post, LSplayQ highlighted a key technical development on the XRP 3-day price chart, pointing to a breakout from a falling wedge pattern. This type of pattern is commonly associated with bullish reversals, signaling that market sentiment may be shifting in favor of the bulls.
Following the breakout, XRP is currently trading around $2.26, and according to LSplayQ, the move suggests that buyers are stepping back in to reclaim control. The price action marks a significant shift after an extended period of downward compression within the wedge. If the bullish momentum continues, LSplayQ notes that XRP could target a breakout level near $2.72, which represents an upside potential of roughly 20% from the current price.
That said, LSplayQ also warns of the risk of a pullback if XRP fails to hold above the wedge breakout level. In such a scenario, the price could retest the $2.10 zone as a potential support. Overall, the technical outlook leans bullish, as long as XRP maintains its position above the breakout level.
Rising Wedge Pattern Signals Caution AheadIn a post on X, The Crypto Bushman pointed out that XRP is pushing higher on the 4-hour chart, but warned that seasoned traders are keeping a close eye on what lies beneath the surface.
According to the analyst, the price is currently trading above both the 20- and 50-day EMAs, which typically signals short-term strength. However, the overall structure appears to be forming a rising wedge, a pattern often linked to potential reversals. At the same time, momentum is beginning to fade, with the MACD flattening and volume tapering off, which Bushman describes as classic signs of a potential trap move.
The Crypto Bushman emphasized that a failure to break cleanly above $2.35 could lead to the setup rolling over. In that case, the $2.25 zone becomes a critical level to watch for a possible breakdown and shift in sentiment. On the flip side, a strong breakout backed by volume could fuel another leg up toward $2.50 if buying pressure returns decisively.
Why this matters
This altcoin story adds another data point to the current market tape and is useful when read alongside nearby source coverage.
Original source
Read on NewsBTCRelated market context

Morgan Stanley leads Solana ETF $9 million inflows as SOL jumps rises above $100
US Solana exchange-traded funds (ETFs) attracted about $9.1 million in net inflows on Aug. 26, led by Morgan Stanley’s MSOL. SoSoV...

Bitcoin (BTC) Price Prediction: Hidden Weekly RSI Divergence Warns of Pullback as BTC Tests $80K
Bitcoin price was trading around $80,500 on Bitstamp in the latest technical reading, up 3.11% on the session. While the price rem...

Ethereum (ETH) Price Prediction: ETH Holds $2,400 Breakout as Bulls Target $2,600 and $2,823
Ethereum price has quietly worked its way back into an important part of the chart after a strong recovery from recent lows. The p...

XRP News: Ripple Latest SEC Filing Shakes Holders
XRP is trading at $1.44, but the number that matters is buried in regulatory filing news. A new SEC document has holders re-readin...
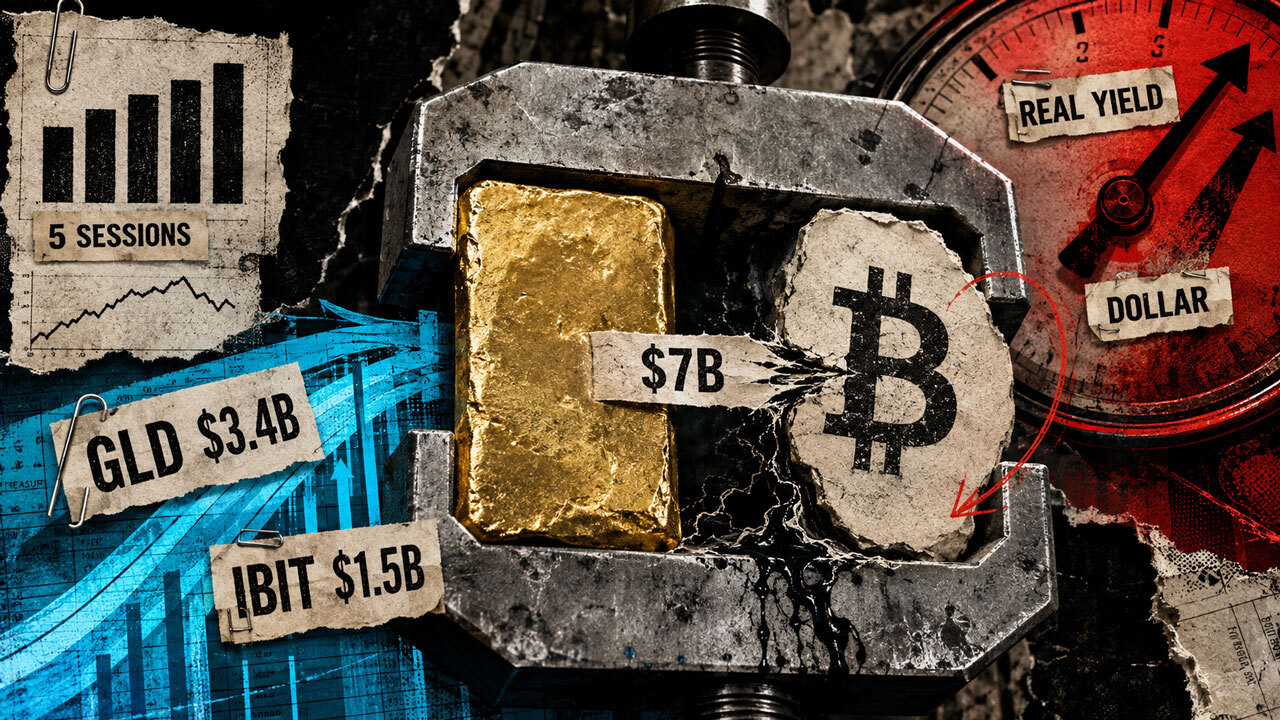
Investors just moved $7 billion into Bitcoin and gold in five days to escape an accelerating dollar crisis
Gold and Bitcoin exchange-traded funds (ETFs) drew roughly $7 billion over five US trading sessions, a record combined haul that p...

Bitcoin Price Prediction: Can BTC Reclaim $80K This Week?
Bitcoin price prediction has the leading digital asset trading at $79,400, down -0.4% on the day, as the market digests a violent...