Cardano (ADA) Faces Fresh Decline: Key Drivers Behind The Downtrend
Cardano price failed to surpass $0.40 and started another decline. ADA is now trading below $0.3850 and might extend losses in the near term. ADA price started a fresh decline and traded below $0.3880. The price is tradi...

Cardano price failed to surpass $0.40 and started another decline. ADA is now trading below $0.3850 and might extend losses in the near term.
- ADA price started a fresh decline and traded below $0.3880.
- The price is trading below $0.3850 and the 100-hourly simple moving average.
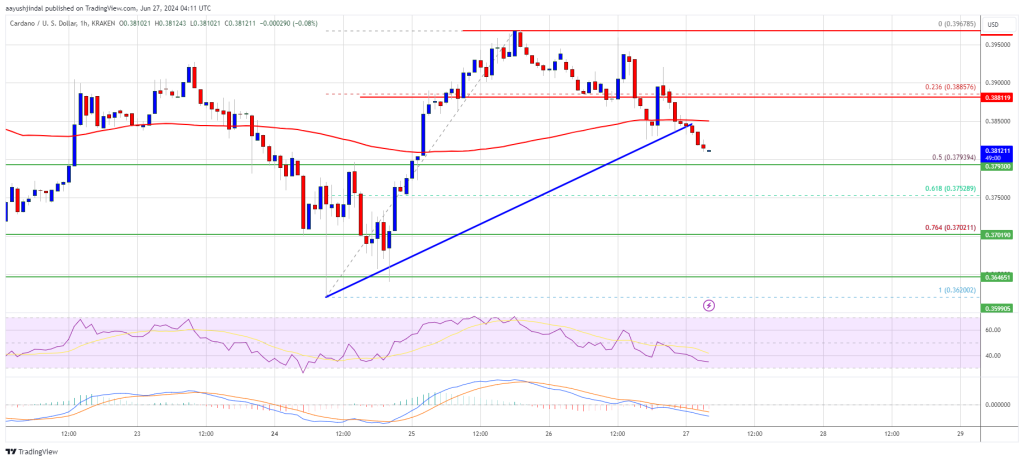
- There was a break below a key bullish trend line with support at $0.3845 on the hourly chart of the ADA/USD pair (data source from Kraken).
- The pair could extend losses and test the $0.370 support zone.
In the past few days, Cardano attempted a recovery wave above the $0.3650 zone like Bitcoin and Ethereum. However, ADA failed to clear the $0.40 resistance zone. A high was formed at $0.3967 and the price started a fresh decline.
There was a move below the $0.3880 and $0.3865 support levels. The price declined below the 23.6% Fib retracement level of the upward move from the $0.3620 swing low to the $0.3967 high. Besides, there was a break below a key bullish trend line with support at $0.3845 on the hourly chart of the ADA/USD pair.
ADA price is now trading below $0.3850 and the 100-hourly simple moving average. If there is another upward move, the price might face resistance near the $0.3850 zone.
The first resistance is near $0.3880. The next key resistance might be $0.40. If there is a close above the $0.40 resistance, the price could start a strong rally. In the stated case, the price could rise toward the $0.4150 region. Any more gains might call for a move toward $0.4250.
More Downsides in ADA?If Cardano’s price fails to climb above the $0.3850 resistance level, it could continue to move down. Immediate support on the downside is near the $0.3795 level or the 50% Fib retracement level of the upward move from the $0.3620 swing low to the $0.3967 high.
The next major support is near the $0.370 level. A downside break below the $0.370 level could open the doors for a test of $0.350. The next major support is near the $0.3350 level.
Technical Indicators
Hourly MACD – The MACD for ADA/USD is gaining momentum in the bearish zone.
Hourly RSI (Relative Strength Index) – The RSI for ADA/USD is now below the 50 level.
Major Support Levels – $0.3790, $0.370, and $0.350.
Major Resistance Levels – $0.3880 and $0.400.
Original source
Read on NewsBTCRelated market context

Standard Chartered Says Bitcoin Bottomed Near $59,000 As Crypto Winter Ends
TL;DR Standard Chartered’s Geoffrey Kendrick reportedly says Bitcoin’s $59,000 area marked the cycle bottom. The note cites SpaceX...

Uranium Holds Above $85 as Mining ETF Rebounds From June Sell-Off
The latest charts display that the market is divided into stable physical prices and uranium shares trying to regain momentum afte...

US forces shoot down Iranian attack drones near Strait of Hormuz, Bitcoin drops below $73K
Geopolitical tensions near vital oil routes can destabilize financial markets, highlighting the interconnectedness of global secur...

Cardano Discord Migration Plan After X Drama for Governance
Key Takeaways: Charles Hoskinson is looking to move these Cardano community discussions from X to Discord. All cardano and midnigh...

Tether USDT Briefly Overtakes Ethereum in Market Cap: A $187B Wake-Up Call
For a few hours, earlier this week, Tether USDT stablecoin held a higher market cap than Ethereum, the first time that has happene...

Bitcoin price challenges $64,000 weekend wall – needing a breakout or risk a deeper correction
Bitcoin reclaimed $64,000 on June 12 and touched an intraday high of $64,301 in the same session that spot ETF flows finally flipp...