Cardano (ADA) Path To Recovery: Can It Fuel a Strong Rally?
Cardano price found support near the $0.3050 level. ADA is now recovering higher and might aim for more gains above the $0.3360 resistance. ADA price started a recovery wave from the $0.3050 level. The price is trading a...

Cardano price found support near the $0.3050 level. ADA is now recovering higher and might aim for more gains above the $0.3360 resistance.
- ADA price started a recovery wave from the $0.3050 level.
- The price is trading above $0.320 and the 100-hourly simple moving average.
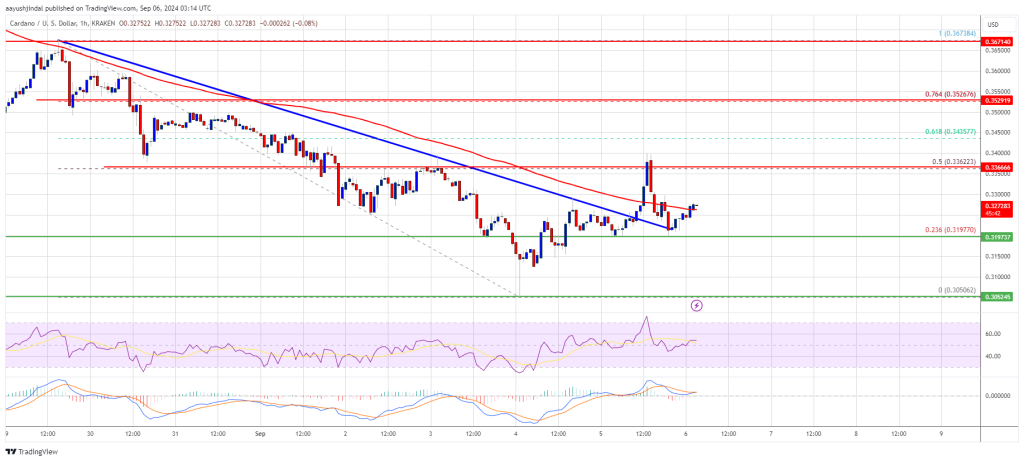
- There was a break above a key bearish trend line with resistance at $0.3245 on the hourly chart of the ADA/USD pair (data source from Kraken).
- The pair could continue to move up if it remains stable above the $0.3200 support zone.
After a major decline, Cardano found support above the $0.30 zone. A low was formed at $0.3050 and the price is now attempting a recovery wave like Bitcoin and Ethereum.
The price climbed above the $0.3200 and $0.3220 resistance levels. There was a move above the 23.6% Fib retracement level of the downward move from the $0.3673 swing high to the $0.3050 low. Besides, there was a break above a key bearish trend line with resistance at $0.3245 on the hourly chart of the ADA/USD pair.
Cardano price is now trading above $0.4220 and the 100-hourly simple moving average. On the upside, the price might face resistance near the $0.330 zone. The first resistance is near $0.3360 or the 50% Fib retracement level of the downward move from the $0.3673 swing high to the $0.3050 low.
The next key resistance might be $0.3450. If there is a close above the $0.3450 resistance, the price could start a strong rally. In the stated case, the price could rise toward the $0.3680 region. Any more gains might call for a move toward $0.400.
Another Decline in ADA?If Cardano’s price fails to climb above the $0.3360 resistance level, it could start another decline. Immediate support on the downside is near the $0.320 level.
The next major support is near the $0.3120 level. A downside break below the $0.3120 level could open the doors for a test of $0.3050. The next major support is near the $0.3000 level where the bulls might emerge.
Technical Indicators
Hourly MACD – The MACD for ADA/USD is gaining momentum in the bullish zone.
Hourly RSI (Relative Strength Index) – The RSI for ADA/USD is now above the 50 level.
Major Support Levels – $0.3200 and $0.3050.
Major Resistance Levels – $0.3360 and $0.3450.
Original source
Read on NewsBTCRelated market context

Uranium Holds Above $85 as Mining ETF Rebounds From June Sell-Off
The latest charts display that the market is divided into stable physical prices and uranium shares trying to regain momentum afte...

Standard Chartered Says Bitcoin Bottomed Near $59,000 As Crypto Winter Ends
TL;DR Standard Chartered’s Geoffrey Kendrick reportedly says Bitcoin’s $59,000 area marked the cycle bottom. The note cites SpaceX...

Tether USDT Briefly Overtakes Ethereum in Market Cap: A $187B Wake-Up Call
For a few hours, earlier this week, Tether USDT stablecoin held a higher market cap than Ethereum, the first time that has happene...

Bitcoin rises above $64,000 after Pakistan prime minister says Iran peace deal is near
Bitcoin traded above $64,000 on Saturday, supported by its strongest ETF inflows in a month and growing optimism around geopolitic...

Bitcoin price faces new risk as big buyers lose conviction
Bitcoin’s largest buyers are no longer behaving like a reliable backstop for the largest cryptocurrency. The exchange-traded funds...

Cardano Discord Migration Plan After X Drama for Governance
Key Takeaways: Charles Hoskinson is looking to move these Cardano community discussions from X to Discord. All cardano and midnigh...