Cardano (ADA) Turns Upward — Signs of a Recovery Emerge
Cardano price started a fresh increase from the $0.5650 zone. ADA is now consolidating and might attempt a clear move above the $0.5925 zone. ADA price started a fresh increase from the $0.5650 support zone. The price is...
Archive context
Older archive item. Useful for background and entity history, but not a fresh market-moving signal.

Cardano price started a fresh increase from the $0.5650 zone. ADA is now consolidating and might attempt a clear move above the $0.5925 zone.
- ADA price started a fresh increase from the $0.5650 support zone.
- The price is trading above $0.5750 and the 100-hourly simple moving average.
- There was a break above a key bearish trend line with resistance at $0.5760 on the hourly chart of the ADA/USD pair (data source from Kraken).
- The pair could start a fresh increase it clears the $0.600 zone.
In the past few sessions, Cardano saw a decent upward move from the $0.5650 zone, like Bitcoin and Ethereum. ADA was able to recover above the $0.5750 and $0.580 resistance levels.
The bulls pushed the price above the 50% Fib retracement level of the downward move from the $0.6107 swing high to the $0.5630 low. Besides, there was a break above a key bearish trend line with resistance at $0.5760 on the hourly chart of the ADA/USD pair.
Cardano price is now trading above $0.5750 and the 100-hourly simple moving average. On the upside, the price might face resistance near the $0.5925 zone. It is close to the 61.8% Fib retracement level of the downward move from the $0.6107 swing high to the $0.5630 low.
The first resistance is near $0.60. The next key resistance might be $0.620. If there is a close above the $0.620 resistance, the price could start a strong rally. In the stated case, the price could rise toward the $0.650 region. Any more gains might call for a move toward $0.6650 in the near term.
Another Decline In ADA?If Cardano’s price fails to climb above the $0.5920 resistance level, it could start another decline. Immediate support on the downside is near the $0.5850 level and the 100 hourly SMA.
The next major support is near the $0.5650 level. A downside break below the $0.5650 level could open the doors for a test of $0.5450. The next major support is near the $0.5320 level where the bulls might emerge.
Technical Indicators
Hourly MACD – The MACD for ADA/USD is gaining momentum in the bullish zone.
Hourly RSI (Relative Strength Index) – The RSI for ADA/USD is now above the 50 level.
Major Support Levels – $0.5850 and $0.5650.
Major Resistance Levels – $0.5920 and $0.6000.
Why this matters
This altcoin story adds another data point to the current market tape and is useful when read alongside nearby source coverage.
Original source
Read on NewsBTCRelated market context

Bitcoin (BTC) Price Prediction: BTC Holds $63K Support—Can Rising Active Addresses Offset Bearish Technical Signals?
Although the BTC price has remained near a key support zone, recent chart signals and Strategy’s sale of a portion of its Bitcoin...

Sui DeFi TVL Breaks $1 Billion As Move-Based Chains Fight For Liquidity
Sui has crossed the $1 billion total value locked mark on DeFiLlama, giving the Move-based network a clearer claim to serious DeFi...

Bitcoin Price Prediction: Peter Brandt Might Dump BTC for Gold
Bitcoin is facing a test, and its price prediction is not helping. So far in 2026, BTC has fallen about 28%, while gold is down ju...

Cardano Node 9.0.0 Release Puts Chang Hard Fork In The Final Stretch
Cardano has reached one of the final technical checkpoints before the Chang hard fork, with node version 9.0.0 now released by Int...

Bitcoin miner bottom signal now depends on who survives weak mining profits
A Bitcoin miner-stress signal circulating on X has fallen into a zone analysts associate with severe miner pressure, putting a fam...
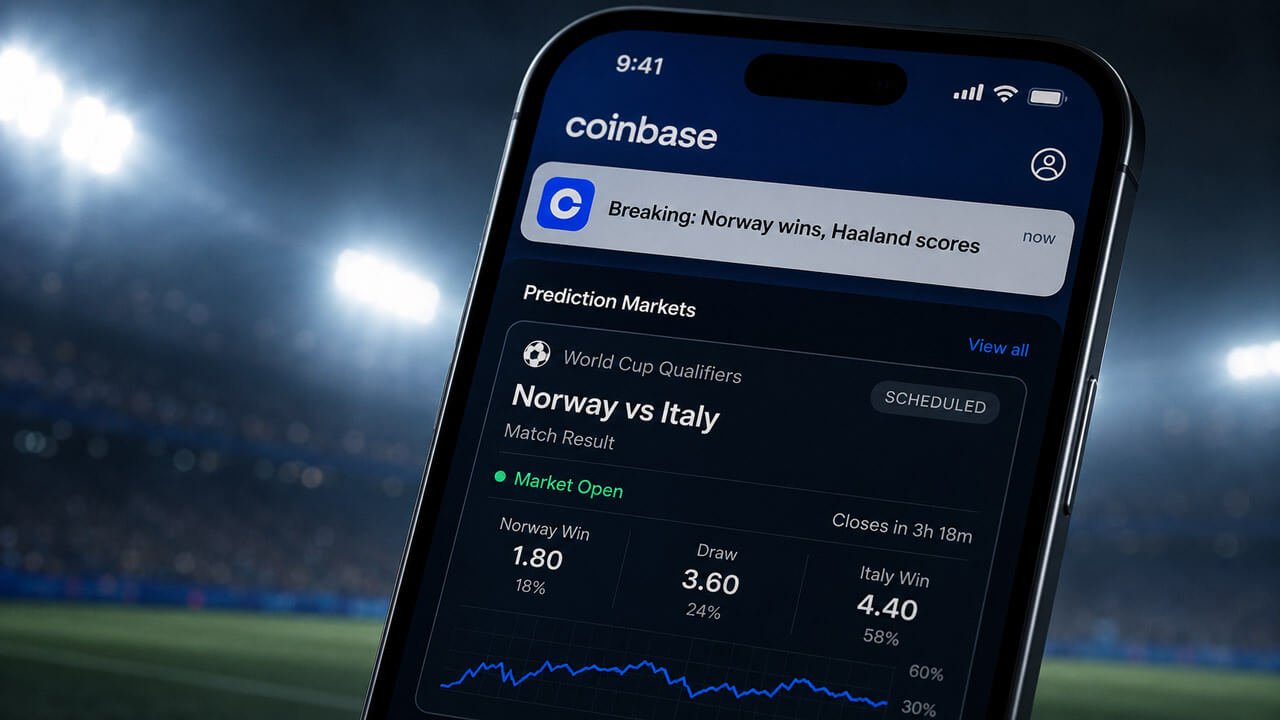
Coinbase World Cup error shows prediction markets still have a proof problem
A reported Coinbase announcement about a World Cup result, likely using AI, created a problem bigger than a flawed alert. It showe...