Chainlink Price Seeks Momentum Around $20 Amid Short-Term Bearish Trend
Maintaining this crucial level is vital, as a breakdown could trigger deeper losses, while a rebound may spark a short-term recovery. Breakout Followed by Pullback Chainlink is trading near $20.71 after a 1.10% daily dec...
Archive context
Older archive item. Useful for background and entity history, but not a fresh market-moving signal.

Maintaining this crucial level is vital, as a breakdown could trigger deeper losses, while a rebound may spark a short-term recovery.
Breakout Followed by PullbackChainlink is trading near $20.71 after a 1.10% daily decline as market pressure persists. Early buying briefly lifted the price above $21.00, but sellers regained control, pushing the token lower. Trading volume fell to roughly $290 million, suggesting reduced activity through most of the session. Market capitalization remains about $14.05 billion, keeping it among the top fifteen cryptocurrencies.
LINKUSD 24-Hr Chart | Source: BraveNewCoin
The daily chart indicates a pattern of lower highs and lower lows, reflecting near-term weakness. Buyers attempted to defend the $21.00 mark several times, but each attempt faced selling pressure. A sustained close below $20.50 could open the path toward $20.00. Conversely, if the $20.50–$20.70 area holds, a rebound toward $21.40 may follow.
Technical View from GammichanAnalyst Gammichan observed that the asset earlier broke above a long-term ascending trendline after multiple tests. A symmetrical triangle pattern formed in recent sessions, where price briefly dipped below support before rebounding strongly. A decisive upward candle then cleared the triangle’s upper boundary, projecting possible upside toward the $26.00–$27.00 range. This move suggested renewed buying pressure and the potential end of the previous corrective phase.
LINKUSD Chart | Source:x
However, the latest price action places Chainlink back below key trend levels. Sustaining the $22.00–$23.00 zone remains essential for a larger rally. Holding this base would enable a potential challenge of $26.00 and eventually $29.00. Without a firm defense of these levels, downside pressure could persist despite the earlier breakout signal.
Fibonacci Levels and Short-Term Trading SetupAnalyst Henry reported that LINK recently slipped beneath the 0.5 Fibonacci retracement near $21.90 and is approaching the 0.618 level around $19.98. He considers this area a near-term target for short-sell scalping. The price structure, marked by lower highs and increased selling activity, supports the likelihood of a test of the $19.00–$20.00 region before any stronger recovery effort.
LINKUSD Chart | Source:x
Henry also pointed out that bulls have not defended mid-range resistance at $22.00–$23.00. For a durable trend reversal, the market would need to reclaim that zone and break above the next resistance near $24.30, which corresponds to the 0.382 Fibonacci level. Until these conditions are met, Henry sees the short-term bias favoring sellers and quick trades with strict stop-loss placements.
Key Support and Resistance LevelsCurrent market action places immediate focus on the $20.50–$20.70 support range. A decisive move below this range may accelerate a drop toward $20.00 and possibly the $19.00–$19.50 Fibonacci target.
On the upside, a recovery above $21.00 would be the first step toward challenging $21.40 and higher. Regaining $22.00–$23.00 remains crucial for reversing the prevailing downtrend. If buyers succeed in holding above these key zones, the longer-term structure indicated by earlier breakouts could reassert itself and drive another attempt toward the $26.00–$27.00 region.
Chainlink continues to consolidate near $20 while traders assess short-term signals. The market remains in a cautious phase as participants monitor whether the current support will hold or if further declines will unfold.
Why this matters
This altcoin story adds another data point to the current market tape and is useful when read alongside nearby source coverage.
Original source
Read on Brave New CoinRelated market context

Bitcoin (BTC) Price Prediction: $74K Liquidity Gap Puts $80K Support to the Test
Meanwhile, data from Glassnode and Fasanara Digital show that traditional financial assets are capturing a growing share of deriva...

Bitcoin Briefly Dips Below $80,000 as AI Worries Weigh on Asian Stocks Before the Fed Decides
Bitcoin slipped under $80,000 during Asian trading hours on Monday, Oct. 26, and stood at $79,785 at 08:07 UTC. It was back at $80...

Quant Crypto Soars 18% as QNT Charges Toward $250
Quant crypto is back in the spotlight after QNT climbed to $216, gaining 18.7% in 24 hours. The move puts the blockchain interoper...
Tether Wins Mining Industry Support For Its Open Automation Toolkit
Tether is trying to make Bitcoin mining equipment easier to operate as one system. Its October 24 announcement brings 15 industry...

Bitcoin Price Rebounds Again, Peter Schiff Repeats His Crash Warnings
Bitcoin price has once again challenged Peter Schiff’s latest crash warning, after the longtime crypto critic predicted BTC would...
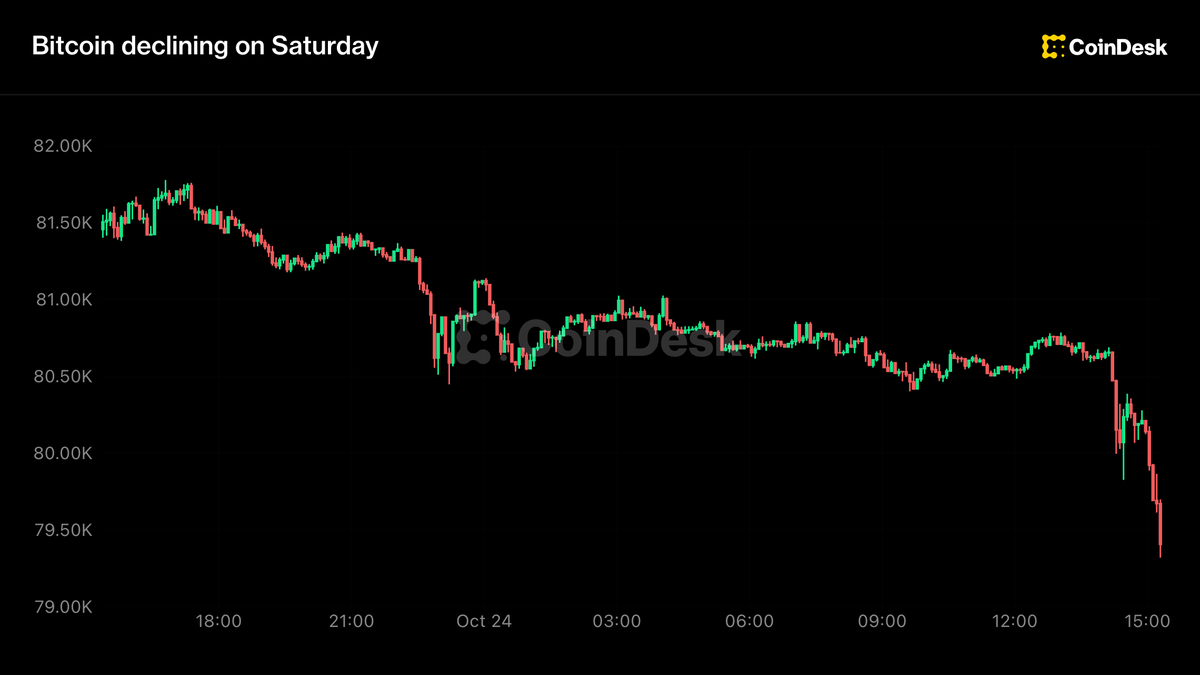
Crypto under weekend pressure, bitcoin slides below $80,000 on U.S. Middle East evacuations
Bitcoin has sunk to its weakest level in more than one month.