Chainlink Signals Upside Break: Analyzing LINK’s Bullish Indicators
Chainlink’s LINK price is recovering from the $12.65 support. The price is gaining bullish momentum and might aim for a move above the $14.20 resistance. Chainlink price is showing bullish signs and eyeing more gains abo...

Chainlink’s LINK price is recovering from the $12.65 support. The price is gaining bullish momentum and might aim for a move above the $14.20 resistance.
- Chainlink price is showing bullish signs and eyeing more gains above $14.00 against the US dollar.
- The price is trading above the $13.50 level and the 100-hourly simple moving average.
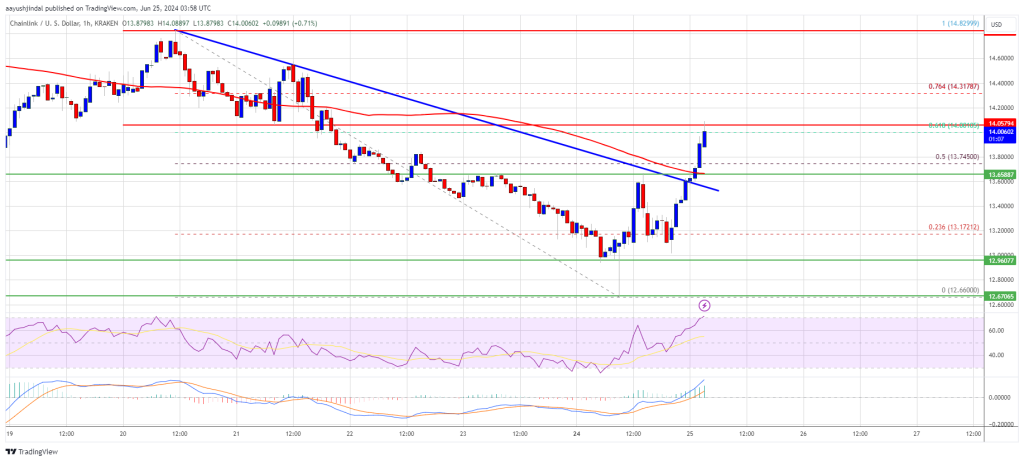
- There was a break above a major bearish trend line with resistance near $13.60 on the hourly chart of the LINK/USD pair (data source from Kraken).
- The price could extend gains if it clears the $14.20 resistance zone.
In the past few sessions, Chainlink saw a decent upward move from the $12.65 zone. There was a move above the $13.00 and $13.20 levels. LINK bulls are now attempting a steady upward move like Ethereum.
There was a clear move above the 50% Fib retracement level of the downward move from the $14.82 swing high to the $12.66 low. There was also a break above a major bearish trend line with resistance near $13.60 on the hourly chart of the LINK/USD pair.
Chainlink is now trading above the $13.50 level and the 100-hourly simple moving average. Immediate resistance is near the $14.05 level or the 61.8% Fib retracement level of the downward move from the $14.82 swing high to the $12.66 low.
The next major resistance is near the $14.20 zone. A clear break above $14.20 may possibly start a steady increase toward the $14.50 level. The next major resistance is near the $14.80 level, above which the price could test $15.00. Any more gains might send the price toward the $15.50 resistance level in the coming sessions.
Are Dips Limited In LINK?If Chainlink’s price fails to climb above the $14.20 resistance level, there could be a downside correction. Initial support on the downside is near the $13.80 level.
The next major support is near the $13.65 level or the 100-hourly simple moving average, below which the price might test the $13.50 level. Any more losses could lead LINK toward the $12.90 level in the near term.
Technical Indicators
Hourly MACD – The MACD for LINK/USD is gaining momentum in the bullish zone.
Hourly RSI (Relative Strength Index) – The RSI for LINK/USD is now above the 50 level.
Major Support Levels – $13.80 and $13.50.
Major Resistance Levels – $14.20 and $14.50.
Original source
Read on NewsBTCRelated market context

Bitcoin price challenges $64,000 weekend wall – needing a breakout or risk a deeper correction
Bitcoin reclaimed $64,000 on June 12 and touched an intraday high of $64,301 in the same session that spot ETF flows finally flipp...

Standard Chartered Says Bitcoin Bottomed Near $59,000 As Crypto Winter Ends
TL;DR Standard Chartered’s Geoffrey Kendrick reportedly says Bitcoin’s $59,000 area marked the cycle bottom. The note cites SpaceX...

Google Gemini AI Predicts Jaw-Dropping XRP Price For Next 90 Days
Google Gemini AI just put XRP back under the spotlight, predicting it is tightly wound for a major breakout toward $1.60 to $1.80...

Kraken, Chainlink, and Chiliz ride crypto’s biggest mainstream stage as FIFA World Cup kicks off
Crypto's integration into the World Cup could drive mainstream adoption, testing blockchain scalability and potentially boosting i...

Crypto’s World Cup play: Kraken, Chainlink, and Algorand stake claims while USMNT sits on the sidelines
The USMNT's lack of crypto partnerships highlights missed opportunities for fan engagement and revenue in a rapidly growing digita...

FIFA World Cup 2026 kicks off with crypto partnerships from Kraken, Chainlink, and Chiliz
The 2026 FIFA World Cup's crypto partnerships could significantly boost blockchain adoption and reshape fan engagement in sports....