Chainlink’s Ambitious Climb: LINK Price Aims for Key Upside Break
Chainlink’s LINK price is consolidating above the $14.00 support. The price could gain bullish momentum if it clears the $14.65 resistance zone. Chainlink price is showing bullish signs and eyeing more gains above $15.00...

Chainlink’s LINK price is consolidating above the $14.00 support. The price could gain bullish momentum if it clears the $14.65 resistance zone.
- Chainlink price is showing bullish signs and eyeing more gains above $15.00 against the US dollar.
- The price is trading below the $15.00 level and the 100-hourly simple moving average.
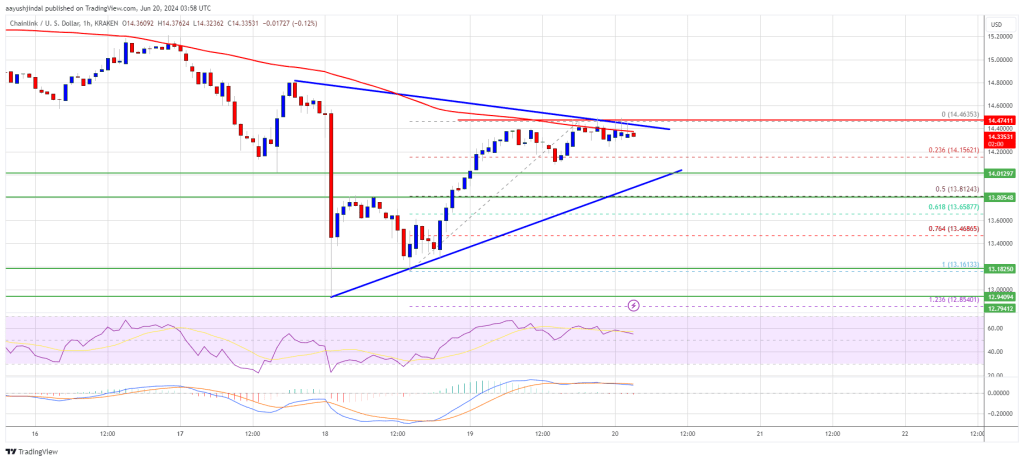
- There is a key contracting triangle forming with resistance near $14.40 on the hourly chart of the LINK/USD pair (data source from Kraken).
- The price could start another increase if it clears the $14.65 resistance zone.
In the past few sessions, Chainlink saw a decent upward move from the $13.00 zone. There was a move above the $13.50 and $14.00 levels. LINK bulls were in action unlike Bitcoin.
However, the price seems to be facing hurdles near the $14.50 and $14.65 levels. A high was formed at $14.63 and the price is now consolidating gains. It is trading above the 23.6% Fib retracement level of the upward move from the $13.16 swing low to the $14.46 high.
Chainlink is now trading below the $15.00 level and the 100-hourly simple moving average. There is also a key contracting triangle forming with resistance near $14.40 on the hourly chart of the LINK/USD pair.
Immediate resistance is near the $14.40 level or the triangle zone. The next major resistance is near the $14.65 zone. A clear break above $14.65 may possibly start a steady increase toward the $15.00 level. The next major resistance is near the $15.20 level, above which the price could test $15.85.
Another Decline In LINK?If Chainlink’s price fails to climb above the $14.40 resistance level, there could be a fresh decline. Initial support on the downside is near the $14.00 level or the triangle trend line.
The next major support is near the $13.80 level or the 50% Fib retracement level of the upward move from the $13.16 swing low to the $14.46 high, below which the price might test the $13.50 level. Any more losses could lead LINK toward the $13.15 level in the near term.
Technical Indicators
Hourly MACD – The MACD for LINK/USD is losing momentum in the bullish zone.
Hourly RSI (Relative Strength Index) – The RSI for LINK/USD is now above the 50 level.
Major Support Levels – $14.00 and $13.80.
Major Resistance Levels – $14.40 and $14.65.
Original source
Read on NewsBTCRelated market context

Standard Chartered Says Bitcoin Bottomed Near $59,000 As Crypto Winter Ends
TL;DR Standard Chartered’s Geoffrey Kendrick reportedly says Bitcoin’s $59,000 area marked the cycle bottom. The note cites SpaceX...

Bitcoin rises above $64,000 after Pakistan prime minister says Iran peace deal is near
Bitcoin traded above $64,000 on Saturday, supported by its strongest ETF inflows in a month and growing optimism around geopolitic...

Kraken, Chainlink, and Chiliz ride crypto’s biggest mainstream stage as FIFA World Cup kicks off
Crypto's integration into the World Cup could drive mainstream adoption, testing blockchain scalability and potentially boosting i...

Crypto’s World Cup play: Kraken, Chainlink, and Algorand stake claims while USMNT sits on the sidelines
The USMNT's lack of crypto partnerships highlights missed opportunities for fan engagement and revenue in a rapidly growing digita...
FIFA World Cup 2026 kicks off with crypto partnerships from Kraken, Chainlink, and Chiliz
The 2026 FIFA World Cup's crypto partnerships could significantly boost blockchain adoption and reshape fan engagement in sports....

FIFA World Cup 2026 kicks off with crypto partnerships from Kraken, Chainlink, and Avalanche
The integration of crypto in the 2026 World Cup could accelerate blockchain adoption, offering new legitimacy and infrastructure f...