Chartist Slams Misleading Dogecoin Analysis: ‘Focus On This Instead’
Technical analyst Kevin, better known on X as @Kev_Capital_TA, rekindled debate over Dogecoin’s market structure on Sunday when he urged traders to ignore the “non-stop TA on DOGE for engagement purposes” and to concentr...
Archive context
Older archive item. Useful for background and entity history, but not a fresh market-moving signal.

Technical analyst Kevin, better known on X as @Kev_Capital_TA, rekindled debate over Dogecoin’s market structure on Sunday when he urged traders to ignore the “non-stop TA on DOGE for engagement purposes” and to concentrate on the two signals that have guided the meme-coin’s price for more than two years. “Not much has changed for Dogecoin here,” he wrote. “Don’t let the other analysts on this platform flood you with non stop TA on DOGE for engagement purposes. We know what to watch for here.”
Dogecoin’s Fate Hinges On ThisKevin’s view hinges on the weekly chart he posted on 26 June. At that time, Dogecoin (DOGE) was hovering near $0.166—and, according to his chart, sitting directly on an ascending support cluster that has defined every major move since the 2022 bear-market washout. “Looking at Dogecoin on the weekly time frame,” he said, “you can see that ever since the bear market breakout on the weekly RSI back in 2022, any time DOGE has hit that level again—which has happened five times now—Doge has gone on to see major bounces. A failure of this weekly RSI level along with a failure of the $0.143-$0.127 level would be the line in the sand between longer term bearish price action or continued bull.”
The chart shows Dogecoin sitting just millimetres above a confluence of the green 0.382 Fibonacci retracement ($0.13778), the upper boundary of a falling trend line that has been in force since May 2021 and the weekly 200 SMA and EMA. Previously, Kevin stated via X: “Weekly 200 SMA and EMA are must holds for Dogecoin along with the macro .382 and down trending support.” Beneath lies the horizontal “line in the sand” at $0.143-$0.127—a zone Kevin has ring-fenced with bold yellow trend lines.
Below the price pane, the weekly Relative Strength Index tells an equally focused story. Kevin has drawn a white band just above the 40-line; the yellow RSI profile has now tapped that band five times. Each tag coincided with a price trough circled in orange on the main chart. The oscillator’s simple moving average (plotted in magenta) has curled below 50 but remains above the 40-support, keeping the pattern intact.
Overhead, Kevin’s chart maps a hierarchy of Fibonacci checkpoints: the 0.5 retracement at $0.18988 (red), the tightly stacked 0.618 ($0.26169) and 0.65 ($0.28548) (yellow), and the 0.786 ($0.41317) (blue). Two large violet supply boxes—one between $1.00 and $1.30 and another around $2.20 and $2.70—represent possible bull run targets. Kevin refrains from forecasting how quickly those zones might come into play, emphasising instead that holding the current support cluster is the single prerequisite for any higher-time-frame bullish thesis.
The analyst also zoomed out to the broader digital-asset landscape in a Sunday follow-up. “The biggest moves for #Altcoins have yet to occur,” he argued, tying potential break-outs to macro-economic easing. “If the macro leads us to further easing and the market sniffs that out … then the ingredients will be in place for a massive move higher on Alts. Altcoins have always required the proper ingredients to make a sustained out-performance over #BTC for months. We’re closer than many understand; we just need a few more things to fall into place.”
For now, Kevin’s message is stripped to its essentials: watch the weekly RSI band and the $0.143-$0.127 price shelf. As long as both survive, the chartist sees no reason to overhaul his structural bias—no matter how crowded the Dogecoin commentary stream becomes.
At press time, DOGE traded at $0.172.
Why this matters
This altcoin story adds another data point to the current market tape and is useful when read alongside nearby source coverage.
Original source
Read on NewsBTCRelated market context

Morgan Stanley leads Solana ETF $9 million inflows as SOL jumps rises above $100
US Solana exchange-traded funds (ETFs) attracted about $9.1 million in net inflows on Aug. 26, led by Morgan Stanley’s MSOL. SoSoV...

Bitcoin (BTC) Price Prediction: Hidden Weekly RSI Divergence Warns of Pullback as BTC Tests $80K
Bitcoin price was trading around $80,500 on Bitstamp in the latest technical reading, up 3.11% on the session. While the price rem...
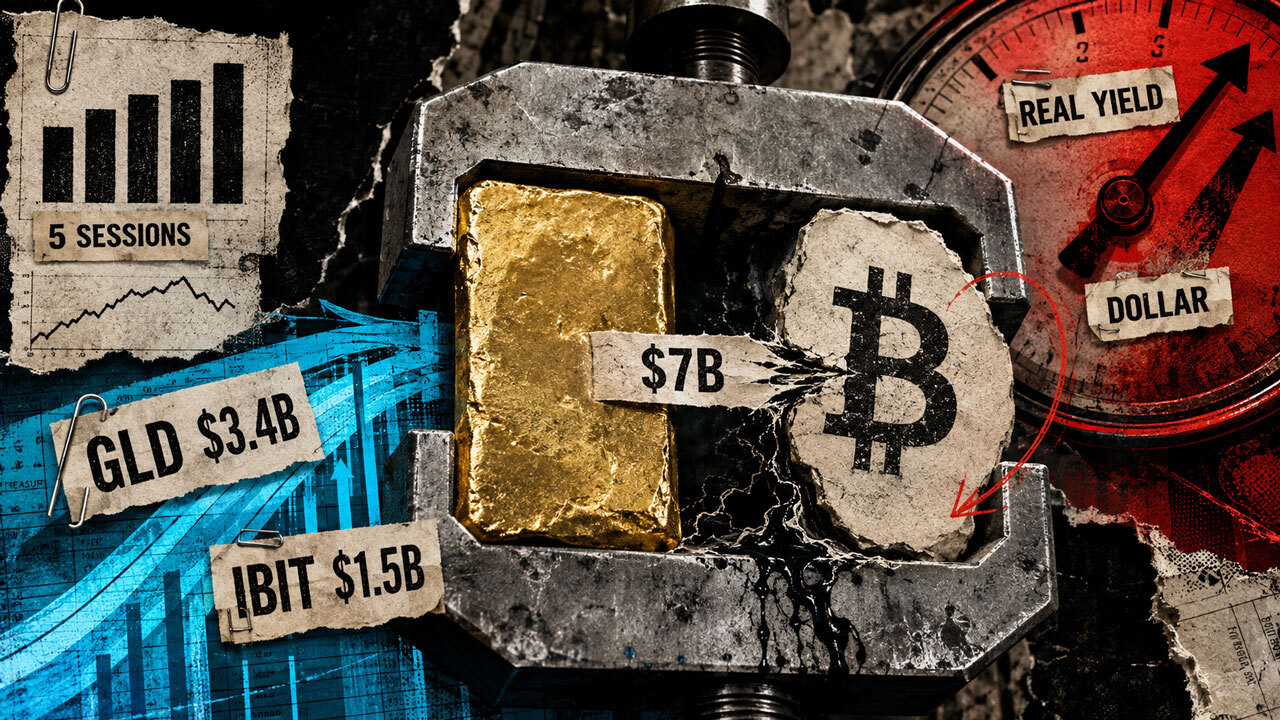
Investors just moved $7 billion into Bitcoin and gold in five days to escape an accelerating dollar crisis
Gold and Bitcoin exchange-traded funds (ETFs) drew roughly $7 billion over five US trading sessions, a record combined haul that p...

It just got 25 times easier to move self-custody Bitcoin directly onto Wall Street, and $5 billion already has
BlackRock cut the minimum for converting privately held Bitcoin into IBIT shares from $25 million to $1 million, while Bitwise low...

Ethereum (ETH) Price Prediction: ETH Holds $2,400 Breakout as Bulls Target $2,600 and $2,823
Ethereum price has quietly worked its way back into an important part of the chart after a strong recovery from recent lows. The p...

Ripple Gets Mastercard Boost as XRP ETF Makes Major Changes
Mastercard deepens its ties to the Ripple ecosystem right as XRP ETF flows show signs of life again. The token is still nowhere ne...