Dogecoin Bears Return: Indicators Point To More Losses In DOGE
Dogecoin started another decline from the $0.1285 resistance zone against the US Dollar. DOGE is consolidating and might resume its decline below $0.1220. DOGE price is moving lower below the $0.1250 support zone. The pr...

Dogecoin started another decline from the $0.1285 resistance zone against the US Dollar. DOGE is consolidating and might resume its decline below $0.1220.
- DOGE price is moving lower below the $0.1250 support zone.
- The price is trading below the $0.1250 level and the 100-hourly simple moving average.
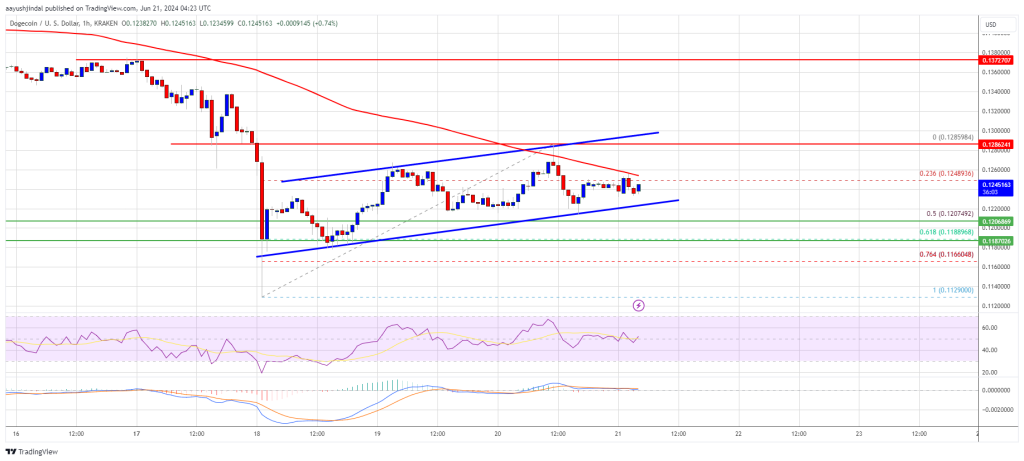
- There is a key rising channel or a bearish flag pattern forming with support near $0.1220 on the hourly chart of the DOGE/USD pair (data source from Kraken).
- The price must settle above $0.1260 and $0.1285 to gain bullish momentum and start a fresh increase.
After a decent recovery wave, Dogecoin price faced resistance near the $0.1285 zone. DOGE failed to continue higher and started a fresh decline from the $0.1285 high like Bitcoin and Ethereum.
There was a move below the $0.1250 support level and the 100-hourly simple moving average. The price dipped below the 23.6% Fib retracement level of the upward move from the $0.1129 swing low to the $0.1285 high. However, the bulls are now active near the $0.1220 zone.
Dogecoin is now trading below the $0.1250 level and the 100-hourly simple moving average. There is also a key rising channel or a bearish flag pattern forming with support near $0.1220 on the hourly chart of the DOGE/USD pair.
If there is a fresh increase, the price might face resistance near the $0.1260 level. The next major resistance is near the $0.1285 level. A close above the $0.1285 resistance might send the price toward the $0.1350 resistance. Any more gains might send the price toward the $0.1420 level. The next major stop for the bulls might be $0.150.
More Losses In DOGE?If DOGE’s price fails to gain pace above the $0.1285 level, it could continue to move down. Initial support on the downside is near the $0.1220 level.
The next major support is near the $0.1185 level. If there is a downside break below the $0.1185 support, the price could decline further. In the stated case, the price might decline toward the $0.1120 level.
Technical Indicators
Hourly MACD – The MACD for DOGE/USD is now gaining momentum in the bearish zone.
Hourly RSI (Relative Strength Index) – The RSI for DOGE/USD is now below the 50 level.
Major Support Levels – $0.1220, $0.1185 and $0.1120.
Major Resistance Levels – $0.1260, $0.1285, and $0.1320.
Original source
Read on NewsBTCRelated market context

Ethereum Price Prediction: 3 Million ETH Rushes Into Staking as Sellers Vanish
Is nobody leaving Ethereum? A record 36 million ETH is now locked in staking, roughly 29–30% of the circulating supply, and the va...

Standard Chartered Says Bitcoin Bottomed Near $59,000 As Crypto Winter Ends
TL;DR Standard Chartered’s Geoffrey Kendrick reportedly says Bitcoin’s $59,000 area marked the cycle bottom. The note cites SpaceX...

US forces shoot down Iranian attack drones near Strait of Hormuz, Bitcoin drops below $73K
Geopolitical tensions near vital oil routes can destabilize financial markets, highlighting the interconnectedness of global secur...

Elon Musk SpaceX AI Predicts Incredible Bitcoin Price For Next 30 Days
Here is the thing about capitulation calls. They only sound smart in hindsight. Right now, with Bitcoin price scraping along the l...

Bitcoin Mining Cost Model Points To $47,000 Floor, But Analysts Urge Caution
TL;DR Crypto Rover says Bitcoin has never bottomed below electrical production cost, currently estimated at $47,000. Mining-cost m...

Are 24/7 CME Bitcoin futures a volatility cure — or a new leverage trap?
Wall Street got to trade Bitcoin around the clock just in time to watch the market fall apart. CME Group launched 24/7 trading for...