Dogecoin (DOGE) Bulls Make A Move — Then Slam Into Resistance
Dogecoin started a recovery wave above the $0.120 zone against the US Dollar. DOGE is now facing hurdles near $0.1240 and might struggle to continue higher. DOGE price started a recovery wave from $0.1175 and climbed abo...
Archive context
Older archive item. Useful for background and entity history, but not a fresh market-moving signal.

Dogecoin started a recovery wave above the $0.120 zone against the US Dollar. DOGE is now facing hurdles near $0.1240 and might struggle to continue higher.
- DOGE price started a recovery wave from $0.1175 and climbed above $0.120.
- The price is trading below the $0.1250 level and the 100-hourly simple moving average.
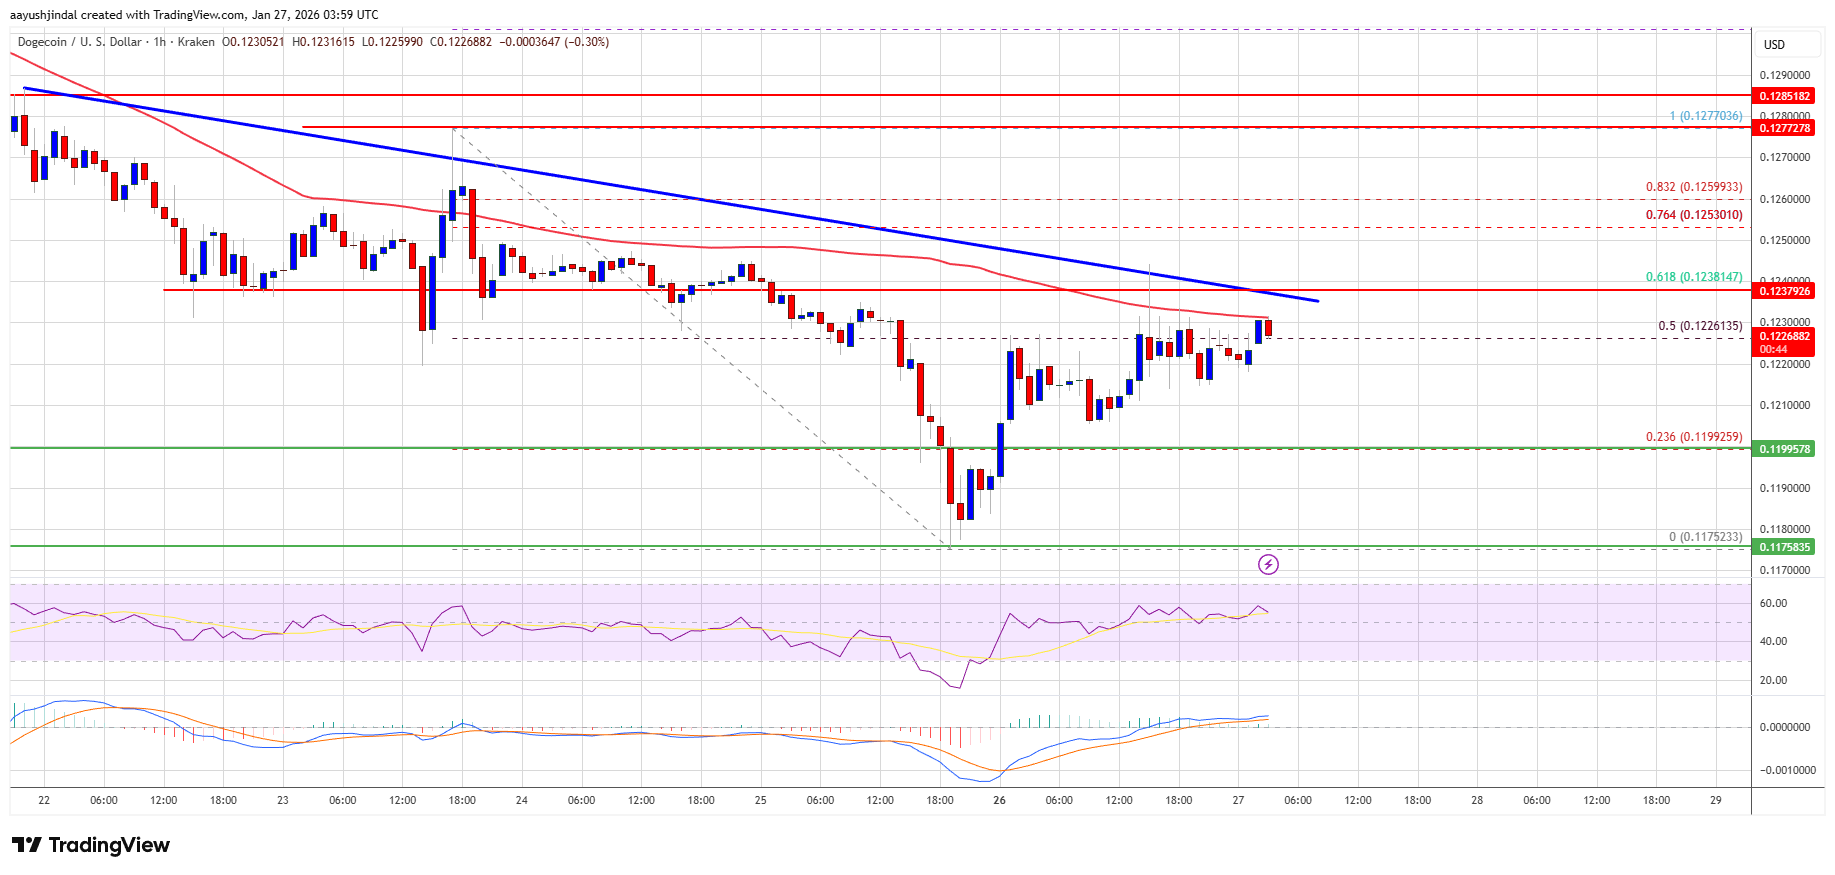
- There is a bearish trend line forming with resistance at $0.1240 on the hourly chart of the DOGE/USD pair (data source from Kraken).
- The price could continue to move up if it stays above $0.1240.
Dogecoin price started a recovery wave from the $0.1175 zone, like Bitcoin and Ethereum. DOGE climbed above the $0.1180 and $0.120 resistance levels.
There was a decent upward move above the 50% Fib retracement level of the downward move from the $0.1277 swing high to the $0.1175 low. However, the bears are active near the $0.1240 level. Besides, there is a bearish trend line forming with resistance at $0.1240 on the hourly chart of the DOGE/USD pair.
Dogecoin price is now trading below the $0.1230 level and the 100-hourly simple moving average. If there is a recovery wave, immediate resistance on the upside is near the $0.1240 level, the trend line, and the 61.8% Fib retracement level of the downward move from the $0.1277 swing high to the $0.1175 low.
The first major resistance for the bulls could be near the $0.1280 level. The next major resistance is near the $0.1320 level. A close above the $0.1320 resistance might send the price toward the $0.140 resistance. Any more gains might send the price toward the $0.1450 level. The next major stop for the bulls might be $0.150.
Another Decline In DOGE?If DOGE’s price fails to climb above the $0.1240 level, it could continue to move down. Initial support on the downside is near the $0.120 level. The next major support is near the $0.1180 level.
The main support sits at $0.1150. If there is a downside break below the $0.1150 support, the price could decline further. In the stated case, the price might slide toward the $0.1080 level or even $0.1050 in the near term.
Technical Indicators
Hourly MACD – The MACD for DOGE/USD is now losing momentum in the bearish zone.
Hourly RSI (Relative Strength Index) – The RSI for DOGE/USD is now above the 50 level.
Major Support Levels – $0.1180 and $0.1150.
Major Resistance Levels – $0.1240 and $0.1280.
Why this matters
Dogecoin is showing up inside the Memecoins theme, so this story is worth tracking for follow-through rather than treating it as a one-off headline.
Original source
Read on NewsBTCRelated market context

Ethereum Price Eyes $2,000 as AI Funds Shift From Chips to ETH, Says Tom Lee
Ethereum is pressing against a price level that has capped every rally. ETH trades at $1,925, little changed over the past 24 hour...

Ethereum News: Builder Activity & Leverage Data Align, $2k Next?
In Ethereum news today, new smart contract deployments on the network have surged 192% above the 90-day baseline, with funding rat...

Worldcoin (WLD) Price Prediction: Can Grayscale’s Worldcoin ETF Filing Trigger a WLD Rebound Above $0.45?
The filing has put the token back in focus at a time when WLD remains well below its recent 2026 highs and technical indicators co...

Ethereum Security Team Turns To AI Agents For Vulnerability Triage
The Ethereum Foundation’s Protocol Security team is using coordinated AI agents to help scan protocol repositories and devnets for...

Ethereum ETF Inflows Extend To Third Day As BlackRock Offsets Fidelity Outflows
US spot Ethereum ETFs have recorded a third consecutive day of net inflows, giving ETH traders another sign that institutional dem...

Ethereum Foundation Publishes Policy Guide For Governments And Institutions
The Ethereum Foundation has published a policy-focused guide aimed at governments, institutions, and public sector leaders, giving...