Dogecoin (DOGE) Slips Into Red Zone, Is a Bigger Crash Looming?
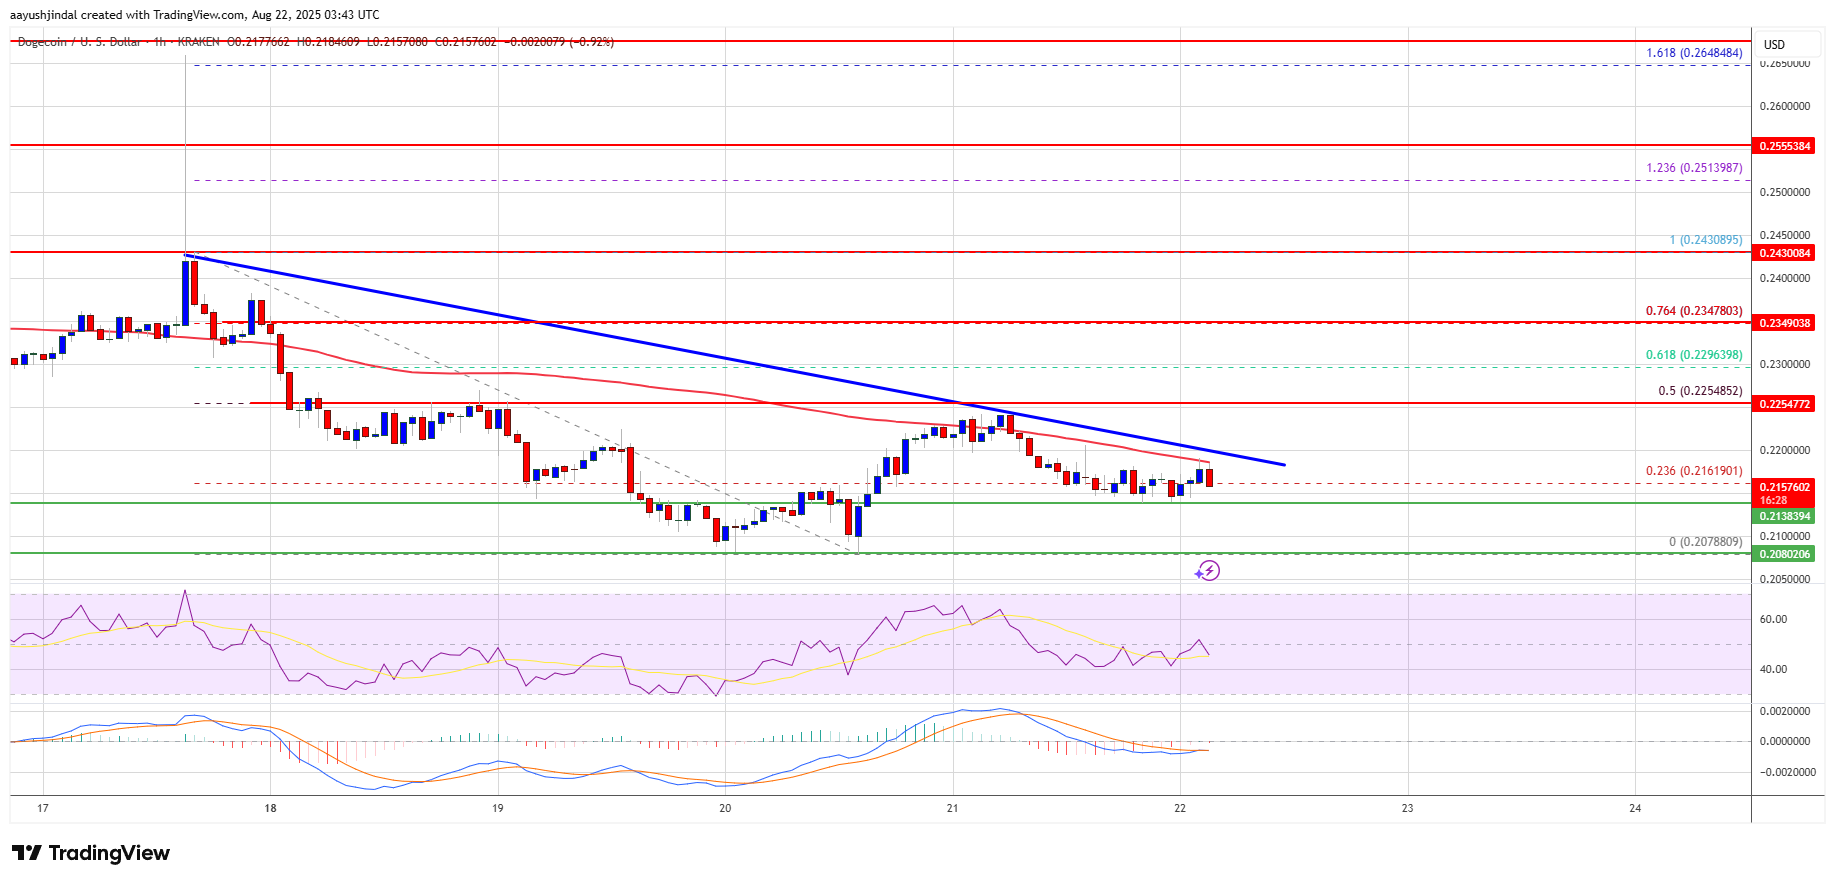
Dogecoin started a fresh decline below the $0.2320 zone against the US Dollar. DOGE is now consolidating and might dip further below $0.210. DOGE price started a fresh decline below the $0.2250 level. The price is tradin...
Archive context
Older archive item. Useful for background and entity history, but not a fresh market-moving signal.

Dogecoin started a fresh decline below the $0.2320 zone against the US Dollar. DOGE is now consolidating and might dip further below $0.210.
- DOGE price started a fresh decline below the $0.2250 level.
- The price is trading below the $0.2250 level and the 100-hourly simple moving average.
- There is a bearish trend line forming with resistance at $0.220 on the hourly chart of the DOGE/USD pair (data source from Kraken).
- The price could start a fresh upward move if it stays above the $0.2080 zone.
Dogecoin price started a fresh decline after there was a close below $0.240, like Bitcoin and Ethereum. DOGE declined below the $0.2320 and $0.2250 support levels.
The price even traded below $0.2120. A low was formed at $0.2078 and the price is now consolidating losses. There was a minor recovery wave above the 23.6% Fib retracement level of the recent decline from the $0.2430 swing high to the $0.2078 low.
Dogecoin price is now trading below the $0.2250 level and the 100-hourly simple moving average. If there is a recovery wave, immediate resistance on the upside is near the $0.220 level. There is also a bearish trend line forming with resistance at $0.220 on the hourly chart of the DOGE/USD pair.
The first major resistance for the bulls could be near the $0.2250 level. It is close to the 50% Fib retracement level of the recent decline from the $0.2430 swing high to the $0.2078 low.
The next major resistance is near the $0.2320 level. A close above the $0.2320 resistance might send the price toward the $0.2450 resistance. Any more gains might send the price toward the $0.250 level. The next major stop for the bulls might be $0.2550.
Another Decline In DOGE?If DOGE’s price fails to climb above the $0.2250 level, it could continue to move down. Initial support on the downside is near the $0.2120 level. The next major support is near the $0.2080 level.
The main support sits at $0.2050. If there is a downside break below the $0.2050 support, the price could decline further. In the stated case, the price might decline toward the $0.20 level or even $0.1920 in the near term.
Technical Indicators
Hourly MACD – The MACD for DOGE/USD is now gaining momentum in the bearish zone.
Hourly RSI (Relative Strength Index) – The RSI for DOGE/USD is now below the 50 level.
Major Support Levels – $0.2120 and $0.2050.
Major Resistance Levels – $0.2250 and $0.2320.
Why this matters
This altcoin story adds another data point to the current market tape and is useful when read alongside nearby source coverage.
Original source
Read on NewsBTCRelated market context

XRP Price Prediction: XRP Faces Critical Resistance Near $1.17 Despite Ripple Securing Landmark EU License
While the company secured a full MiCA license that expands its operations across the European Economic Area, market indicators sug...

Iran shoots down US MQ-9 Reaper drone, Bitcoin drops below $73K as nearly $1B in crypto liquidations follow
Geopolitical tensions highlight crypto market volatility, underscoring the interconnectedness with traditional finance and potenti...

Sam Altman ChatGPT AI Predicts Insane Bitcoin Price by 2026
Sam Altman ChatGPT AI just circled November on the calendar and put a number next to Bitcoin Price Prediction. The model predicts...

Elon Musk Grok AI Predicts Incredible XRP Price Target by End of 2026
Elon Musk Grok AI just published what might be the most partnership-heavy XRP price prediction in this entire series. The model pr...

Ethereum is losing ownership of crypto payments as Base moves $565B in stablecoins
Stablecoin activity is becoming a contest over which blockchains move the most tokenized dollars. Visa Onchain Analytics showed th...

Vitalik Buterin Proposes ‘Extremely Lean’ Ethereum That Cuts Validator State by 95% Using ZK Proofs
Ethereum co-founder Vitalik Buterin published a technical proposal Monday called “The Extremely Lean Chain,” outlining a two-phase...