Dogecoin Follows The Blueprint: Analyst Highlights Perfect Technical Execution
Dogecoin’s price action continues to honor the technical “blueprint” laid out by crypto analyst Kevin (@Kev_Capital_TA), who reaffirmed on Sunday that his strategic roadmap from March 22 remains intact. The weekly chart...
Archive context
Older archive item. Useful for background and entity history, but not a fresh market-moving signal.
Dogecoin’s price action continues to honor the technical “blueprint” laid out by crypto analyst Kevin (@Kev_Capital_TA), who reaffirmed on Sunday that his strategic roadmap from March 22 remains intact. The weekly chart reveals an extended descending channel drawn with multiple yellow trend lines that originated in 2021 and constricted price action throughout 2022.
Within that formation, the most critical horizontal threshold appears to be $0.139, labeled on the chart as the “Last line in the sand” and described by Kevin as essential for preserving bullish market structure. He notes that maintaining durable weekly closes above this zone is paramount for further upside, while a decisive break beneath $0.139 would nullify the bullish thesis.
Dogecoin Follows The BlueprintDogecoin’s retracement from highs near $0.45 earlier this year has so far been contained by a confluence of support channels and Fibonacci retracement levels. According to Kevin’s chart, the primary Fib levels span from roughly $0.049 at the lower bound (0% Fib) to around $2.268 at the 1.414 extension.
Closer inspection shows intermediate Fibonacci markers at $0.090 (0.236), $0.138 (0.382), $0.190 (0.50), $0.262 (0.618), $0.413 (0.786), $0.542 (0.88), $0.738 (1.0), $0.934 (1.0866), and $1.543 (1.272). Since the price is hovering near $0.16–$0.17 at press time, Dogecoin has remained above the 0.382 retracement near $0.138, reinforcing Kevin’s argument that the risk-reward ratio at this level appears “absolutely phenomenal.”
Kevin’s March 22 update describes the confluence of several higher time frame indicators, including the Weekly Stochastic RSI, the 3-Day MACD, and the 2-Week Stochastic RSI, all of which he sees nearing full resets. He cites the previous weekly demand candle, which formed just above $0.139, as a key sign that buyers are stepping in to defend what he calls “the Last line of bull market support.”
The Weekly Stoch RSI on his chart is already situated at low levels, while the 3-Day MACD and 2-Week Stoch RSI appear roughly a month away from bottoming out. According to Kevin, these technical resets should serve as a springboard for Dogecoin’s next significant upward move, provided that Bitcoin, which he believes must hold above $70K in his scenario, remains stable enough to support broader market strength.
On Sunday, Kevin reminded his audience that this strategy, first made public on March 22, is going “exactly according to plan,” given Dogecoin’s confirmed bounce around the $0.139 region and the ongoing drift toward oversold conditions in multiple momentum gauges. He disclosed that his Patreon trading portfolio holds an average entry at $0.15 for this swing and noted that a swift rejection of sub-$0.139 weekly closes, coupled with the bullish stance of the higher time frame indicators, corroborates his confidence in Dogecoin’s recovery potential.
While he acknowledges that “lots of work” still needs to be done for Dogecoin to reclaim loftier levels near the 0.618 Fib around $0.262 or even the 0.786 Fib at $0.413, Kevin maintains that his initial thesis stands as long as the meme-inspired asset preserves its foothold above $0.139. For him, the risk of a breakdown is well-defined if the pivotal support gives way, but should the level persist, he sees the upside potential extending far beyond the current range. As of now, Dogecoin’s price continues to cling to that all-important line in the sand, keeping Kevin’s bullish blueprint very much alive.
At press time, DOGE traded at $0.16493.
Why this matters
This altcoin story adds another data point to the current market tape and is useful when read alongside nearby source coverage.
Original source
Read on NewsBTCRelated market context

XRP vs Bitcoin: Investor Says RLUSD Growth and Regulatory Clarity Could Shift Crypto’s Balance of Power
While the claim remains highly ambitious given Bitcoin’s commanding lead in market capitalization, the discussion highlights broad...

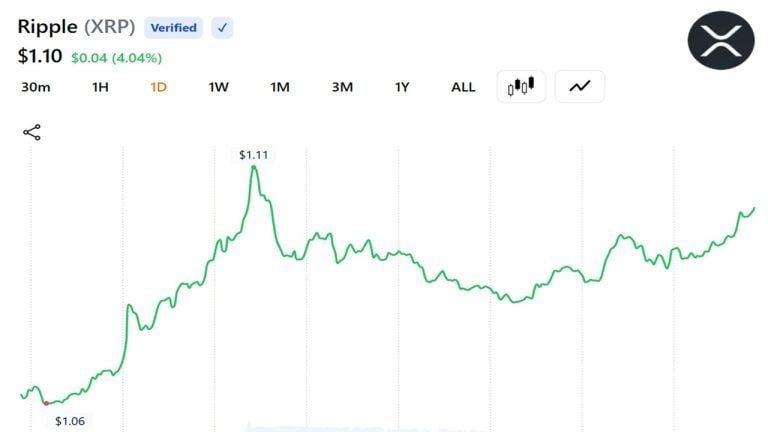
XRP Price Prediction: SuperTrend Buy Signal Meets Shrinking Supply as $1.24 Breakout Comes Into Focus
After a fresh SuperTrend buy signal appeared on the 4-hour chart, analysts are watching whether the XRP price can extend its recen...

Bitcoin whales send 49,000 BTC to exchanges as $60K rebound shows signs of weakness
Bitcoin’s recovery above $60,000 is facing a fresh test from exchange-flow and derivatives data after large holders moved one of t...

Bitcoin Price Eyes Recovery After END-OF-CYCLE STRC Shock, Bitwise CIO Says Strategy Will Be ‘Less Important’ Next BTC Cycle
While improving macroeconomic conditions have supported a modest Bitcoin price rebound, Bitwise Chief Investment Officer Matt Houg...
Santiment: XRP Returns Sink to Lowest Levels Since December 2020 as Relief Rally Odds Climb
XRP holders are sitting on some of their steepest average losses in years, according to analytics firm Santiment, a setup it says...
BTC USD Recovering: Why is The Crypto Market Going Up Today, July 2nd?
After a rough June, the crypto market finally found its footing today. BTC USD climbed back above $60,000, while the total crypto...