Dogecoin Price Prediction – Will DOGE Bulls Be Able To Hit $0.092?
Dogecoin is showing positive signs above the $0.0750 resistance against the US Dollar. DOGE could rally over 10% if it clears the $0.0812 resistance zone. DOGE started a decent increase above the $0.0750 resistance again...
Archive context
Older archive item. Useful for background and entity history, but not a fresh market-moving signal.

Dogecoin is showing positive signs above the $0.0750 resistance against the US Dollar. DOGE could rally over 10% if it clears the $0.0812 resistance zone.
- DOGE started a decent increase above the $0.0750 resistance against the US dollar.
- The price is trading above the $0.0785 level and the 100 simple moving average (4 hours).
- There is a key bullish trend line forming with support near $0.0792 on the 4-hour chart of the DOGE/USD pair (data source from Kraken).
- The price could start a strong rally like Solana if it clears the $0.0812 resistance.
After forming a base above the $0.070 level, Dogecoin price started a fresh increase. DOGE broke the $0.0725 resistance zone to move into a positive zone, like Bitcoin and Ethereum.
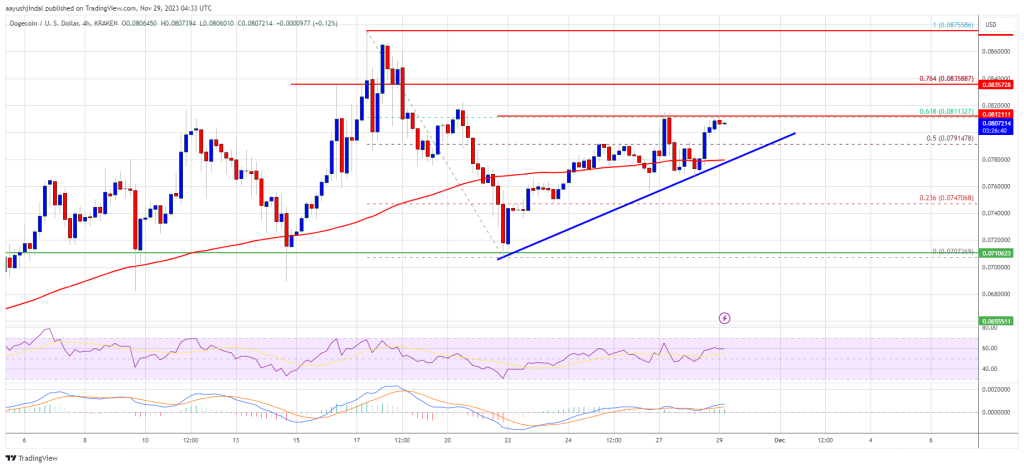
The bulls were able to push the price further above the $0.0750 resistance. There was a clear move above the 50% Fib retracement level of the downward move from the $0.0875 swing high to the $0.0707 low. However, the price seems to be struggling near the $0.0812 resistance.
DOGE is now trading above the $0.0785 level and the 100 simple moving average (4 hours). There is also a key bullish trend line forming with support near $0.0792 on the 4-hour chart of the DOGE/USD pair.
On the upside, the price is facing resistance near the $0.0812 level. It is close to the 61.8% Fib retracement level of the downward move from the $0.0875 swing high to the $0.0707 low. The next major resistance is near the $0.0835 level.
Source: DOGEUSD on TradingView.com
A close above the $0.0835 resistance might send the price toward the $0.088 resistance. The next major resistance is near $0.0920. Any more gains might send the price toward the $0.095 level.
Are Dips Supported in DOGE?If DOGE’s price fails to gain pace above the $0.0812 level, it could start a downside correction. Initial support on the downside is near the $0.0792 level and the trend line.
The next major support is near the $0.0770 level. If there is a downside break below the $0.0770 support, the price could decline further. In the stated case, the price might decline toward the $0.0710 level.
Technical Indicators
4 Hours MACD – The MACD for DOGE/USD is now gaining momentum in the bullish zone.
4 Hours RSI (Relative Strength Index) – The RSI for DOGE/USD is now above the 50 level.
Major Support Levels – $0.0792, $0.0770, and $0.0710.
Major Resistance Levels – $0.0812, $0.0835, and $0.0880.
Why this matters
This altcoin story adds another data point to the current market tape and is useful when read alongside nearby source coverage.
Original source
Read on NewsBTCRelated market context

XRP Price Prediction: SuperTrend Buy Signal Meets Shrinking Supply as $1.24 Breakout Comes Into Focus
After a fresh SuperTrend buy signal appeared on the 4-hour chart, analysts are watching whether the XRP price can extend its recen...

Leading Claude AI Fable 5 Predicts Stunning XRP Price by The End of 2026
Anthropic’s new Claude AI model, Fable 5, predicts XRP price for the entire second half around a single event that could be resolv...

Vitalik Buterin unveils “Lean Ethereum” roadmap for quantum resistance by 2029
Ethereum's proactive roadmap enhances its resilience and appeal, potentially boosting market confidence and investment in its futu...

Micron stock soars nearly 700% in a year as tokenized version trades on Ethereum via Ondo
Micron's stock surge and tokenization highlight the growing intersection of traditional finance and decentralized finance, impacti...

Ethereum returns to top 100 global assets as market cap climbs back above $215 billion
Ethereum's market cap recovery enhances its appeal to institutional investors, potentially boosting its role in decentralized fina...

XRP vs Bitcoin: Investor Says RLUSD Growth and Regulatory Clarity Could Shift Crypto’s Balance of Power
While the claim remains highly ambitious given Bitcoin’s commanding lead in market capitalization, the discussion highlights broad...