Dogecoin Shows ‘Clean’ Bullish Divergence Amid Market Turmoil: Crypto Analyst
After Dogecoin temporarily fell by more than 22% yesterday amid rumors of a “Black Friday”, the price has since been able to recover at least some of its losses. Nevertheless, DOGE is still down around 11% since the star...
Archive context
Older archive item. Useful for background and entity history, but not a fresh market-moving signal.

After Dogecoin temporarily fell by more than 22% yesterday amid rumors of a “Black Friday”, the price has since been able to recover at least some of its losses. Nevertheless, DOGE is still down around 11% since the start of the week. This has put the price of Dogecoin in a tricky situation.
Dogecoin Forms Bull DivDogecoin breached a critical ascending support line before quickly recovering, a behavior that crypto analyst Kevin (@Kev_Capital_TA) describes as testing the “lines in the sand” for this ongoing bull market structure.
Related Reading: Dogecoin Crashes 20%, But ‘Bull Line’ Signals Hope For HODLers
Kevin’s shared chart indicates that DOGE temporarily dipped below a rising pink trendline that has been in place since mid-2023, yet managed to close the daily candle back above this historically significant support around the $0.138 region—a level that also coincides with the 38.2% Fibonacci retracement level measured from the $0.049 swing low to the approximately $0.738 peak.
The analyst points out that, despite the intraday break, DOGE’s recovery formed what he calls a “clean bullish divergence” on the daily time frame, referencing the Relative Strength Index which has begun climbing even as price made a slightly lower low. He likened this development to a similar divergence unfolding on Bitcoin’s chart, suggesting that Dogecoin’s momentum may be stabilizing after a series of drawn-out declines from the $0.48 high set early December last year.
DOGE Uptrend Remains IntactCharting Guy (@ChartingGuy) weighed in separately, highlighting that Dogecoin has arrived once more at its weekly 200 EMA zone—an important trend marker hovering in the mid-$0.13 range—and that its overall structure still shows “higher highs, higher lows” when viewed on a broader timescale.
His posted chart also features a Fibonacci analysis which shows that DOGE could manage to close above the 0.382 Fib level, reinforcing the notion that DOGE’s ability to hold above $0.15 could be a crucial gauge of bullish continuation. Failure to sustain this level, however, would risk revisiting deeper Fibonacci support levels, including the 23.6% retracement near $0.09 or even the 13.6% level around $0.07.
On the upside, traders may look to potential resistance zones in the mid-$0.20s, which line up with the 61.8% Fibonacci retracement at roughly $0.2671, and the high-$0.30s to low-$0.40s range tied to deeper retracement zones up to the 78.6% mark.
The chart watcher also notes that a retest of the prior swing highs above $0.40 would align with an extended push toward the 88.8% Fibonacci near $0.56, although market participants remain cautious amid the broader volatility that is brought to the market by US President Donald Trump’s tariff policies.
At press time, DOGE traded at $0.149.
Why this matters
This altcoin story adds another data point to the current market tape and is useful when read alongside nearby source coverage.
Original source
Read on NewsBTCRelated market context

Bitcoin whales send 49,000 BTC to exchanges as $60K rebound shows signs of weakness
Bitcoin’s recovery above $60,000 is facing a fresh test from exchange-flow and derivatives data after large holders moved one of t...

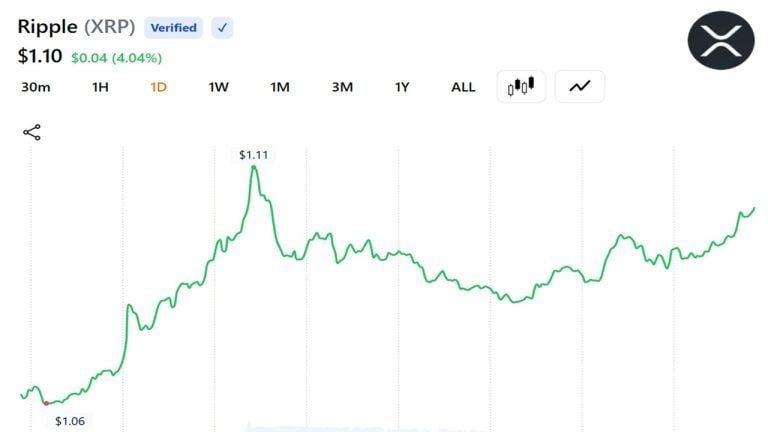
XRP Price Prediction: SuperTrend Buy Signal Meets Shrinking Supply as $1.24 Breakout Comes Into Focus
After a fresh SuperTrend buy signal appeared on the 4-hour chart, analysts are watching whether the XRP price can extend its recen...
Bitcoin ETFs see biggest inflow since May after weak US jobs report sparks BTC price rebound
US spot Bitcoin exchange-traded funds (ETFs) drew their largest daily inflow since May after a weaker-than-expected jobs report ea...

Leading Claude AI Fable 5 Predicts Stunning XRP Price by The End of 2026
Anthropic’s new Claude AI model, Fable 5, predicts XRP price for the entire second half around a single event that could be resolv...

StanChart joins ESMA's first MiCA register update since deadline
ESMA publishes its first post-deadline MiCA register update, adding 37 crypto-asset service providers, including Standard Chartere...
Santiment: XRP Returns Sink to Lowest Levels Since December 2020 as Relief Rally Odds Climb
XRP holders are sitting on some of their steepest average losses in years, according to analytics firm Santiment, a setup it says...