If Dogecoin Falls Below This Level, A Freefall To $0.06 Is Possible: Analyst
In a post on X on Tuesday, crypto analyst Ali Martinez (@ali_charts) shared a long‐term Dogecoin (DOGE) price chart highlighting a critical support level that, if lost, could open the door for a steep correction. Martine...
Archive context
Older archive item. Useful for background and entity history, but not a fresh market-moving signal.

In a post on X on Tuesday, crypto analyst Ali Martinez (@ali_charts) shared a long‐term Dogecoin (DOGE) price chart highlighting a critical support level that, if lost, could open the door for a steep correction. Martinez pinpointed $0.19 as the line in the sand. Should the meme‐inspired token dip below this threshold, he argues, “the probability of a deeper correction toward $0.06 significantly increases.”
Dogecoin Crash To $0.06 Incoming?The weekly chart—which spans back to early 2014—depicts Dogecoin trading within a broad ascending channel. Solid black trend lines enclose most of the price action from DOGE’s earliest sub‐penny valuations to the all‐time high of roughly $0.73 in 2021. Dashed lines running parallel to these trend lines appear to act as mid‐channel guides, capturing smaller swings within Dogecoin’s larger market cycles.
Notably, DOGE has spent prolonged periods moving laterally within the lower range of this channel, only to break out sharply when it has tested the upper boundaries. When Martinez posted the chart, Dogecoin was seen hovering around $0.225, just above a key horizontal support region in the chart.
Overlaid on the channel are extensive Fibonacci levels derived from Dogecoin’s long‐term price history. The 0.786 Fib retracement—commonly viewed as a make‐or‐break support in deeper corrections—seems to align near $0.1978, very close to the $0.19 level Martinez highlighted.
Below $0.19, the chart shows few immediate technical cushions until roughly $0.13, which is aligning with the lower part of the multi‐year ascending channel. Beneath that, the $0.06 price point emerges as the most prominent downside target, potentially matching a key historical congestion area and aligning with the lower part of the multi‐year ascending channel.
Among the other Fibonacci levels visible on the chart are the 0.618 Fib near $0.05, 0.5 Fib near $0.03, 0.382 Fib near $0.015 and 0.236 Fib near $0.0059. While these lower Fib lines may not all come into play, they help map out DOGE’s historical support/resistance zones in the event of an extended sell‐off.
The chart also shows higher Fib extension levels such as 1.272 (around $4.10), 1.414 (around $10.04), and 1.618 (around $36.32). Though these may appear far‐fetched given current market conditions, such extensions on a long‐term chart can serve as reference points if Dogecoin were to regain strong bullish momentum and climb toward new heights in future market cycles.
For now, all eyes are on $0.19 as Dogecoin’s crucial inflection point. If DOGE holds above this level, it may preserve its place in the mid‐range of the ascending channel. However, as Ali Martinez warns, a breach of $0.19 could intensify downward pressure and potentially set Dogecoin on a path toward $0.06.
At press time, DOGE traded at $0.206.
Why this matters
This altcoin story adds another data point to the current market tape and is useful when read alongside nearby source coverage.
Original source
Read on NewsBTCRelated market context

Sui (SUI) Price Prediction: ETF Inflows and 100MA Support Strengthen $1.15 Outlook
Recent SUI price action has focused attention on the $0.73-$0.76 area, where several short- and medium-term moving averages are pr...
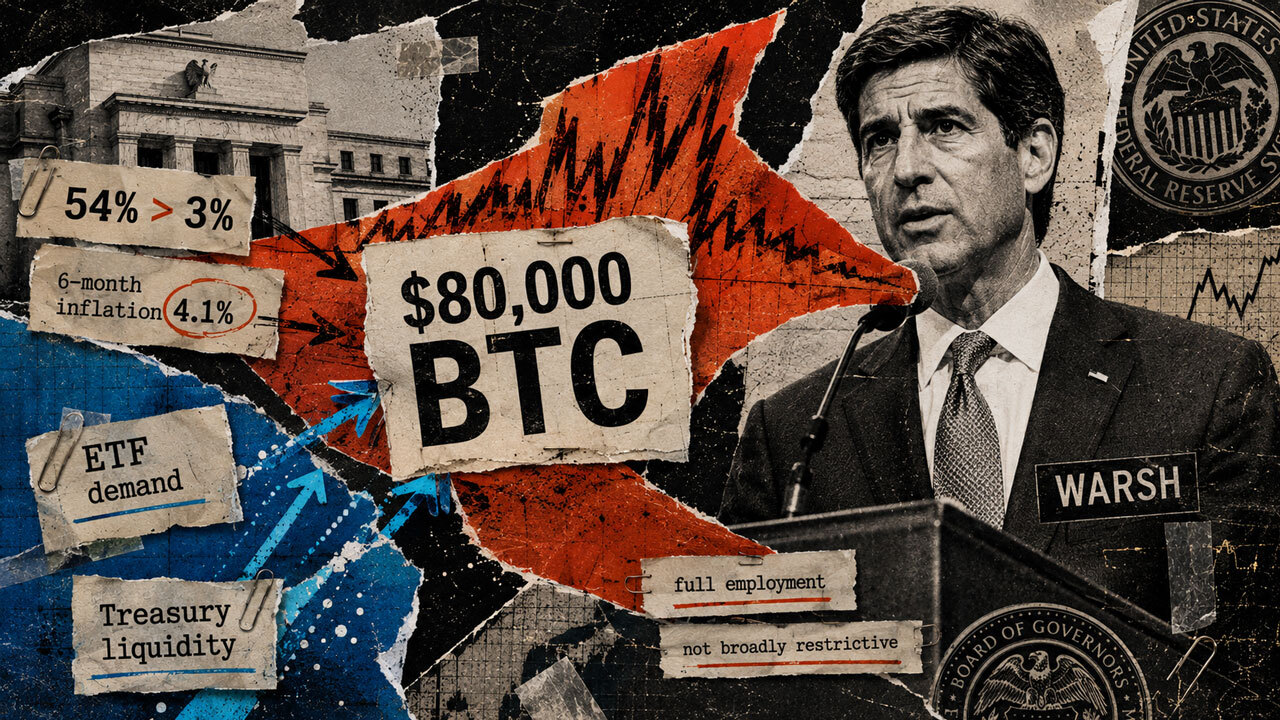
Bitcoin faces a new macro test as Fed Chair Kevin Warsh highlights sticky inflation metrics
Bitcoin has 54% as a new macro number to defend against, the share of the personal consumption expenditures basket that Federal Re...

Ethereum Price Faces Glamsterdam Test as 3X Network Speed Threatens Smart Contracts
Ethereum price is starting to stabilize, as the network’s next major upgrade puts its core economic assumptions under scrutiny. Th...

Bitcoin’s failed $81,000 breakout just put $75,000 back on the table
Bitcoin trades near $78,000 heading into the weekend, sitting almost between $77,000 support and $80,000 resistance after a sharp...

XRP Price Analysis: Treasury Giant One Step Away From NASDAQ
XRP is trading at $1.42 as one of its biggest institutional backers edges closer to a public listing despite some bearish price an...

Bank Plans on CLARITY Act Send Circle and Coinbase Shares Lower
Circle (CRCL) and Coinbase (COIN) shares both fell more than 3% after reports that JPMorgan Chase and a consortium of major banks...