Is Solana About To Break Out? Key Levels And Indicators Say Watch Closely
Solana is exhibiting strong bullish signs supported by moving averages, volume, and momentum indicators, which hint at a short-term pause or consolidation in the rally. What Bulls Need To Watch To Sustain The Rally In an...
Archive context
Older archive item. Useful for background and entity history, but not a fresh market-moving signal.

Solana is exhibiting strong bullish signs supported by moving averages, volume, and momentum indicators, which hint at a short-term pause or consolidation in the rally.
What Bulls Need To Watch To Sustain The RallyIn an X post, Gemxbt stated that the Solana 1-hour chart has displayed a bullish market structure, with the price trading above the 5, 10, and 20-day moving averages. The indication of short-term moving averages signals strong upward momentum, which shows that buyers are in control. The recent price action has been supported by notable volume spikes, confirming the strength behind the upward moves and adding credibility to the rally.
The key resistance is around $154, where SOL has previously faced selling pressure. This zone will determine whether bullish momentum can push the price higher. On the downside, support is sitting near $150, which is acting as a cushion to absorb any immediate selling pressure and prevent a deeper pullback.
The Relative Strength Index (RSI) is approaching overbought territory, which may signal that the asset is due for a period of consolidation or sideways movement before continuing its climb. Meanwhile, the Moving Average Convergence Divergence (MACD) has recently shown a bullish crossover, reinforcing the uptrend and suggesting the upward momentum could continue if buying interest persists.
Crypto investor and trader Theodor Coin also revealed that the Solana 1-hour chart is showing a clear recovery after the dip seen in early July. The open interest is trending upward and has now surpassed $3.62 billion.
An increase here typically indicates growing trader market engagement, which is a precursor to heightened volatility and significant price moves. From here, a breakout above the $154 resistance could unleash a powerful rally fueled by the increasing market interest and positive momentum.
Uptrend Line Remains Intact — A Positive SignA crypto analyst known as Day on X also updated that Solana is holding above the long-term support area around $120 on the weekly chart, a level that has been a launchpad for rallies.
The long-term uptrend line remains intact, and with each higher low, the case for a massive cup-and-handle pattern becomes stronger. However, this pattern won’t confirm until SOL breaks above the critical $250 resistance zone, a level that capped price action during the previous rally.
If SOL manages to break out above the $250 zone, it could unlock a measured move price target of $500, which marks a milestone in Solana’s recovery and expansion. The analyst also noted that SOL is not there yet, and that the first step for bulls is reclaiming $185 resistance level, which has consistently rejected upside attempts.
Why this matters
This altcoin story adds another data point to the current market tape and is useful when read alongside nearby source coverage.
Original source
Read on NewsBTCRelated market context

Morgan Stanley leads Solana ETF $9 million inflows as SOL jumps rises above $100
US Solana exchange-traded funds (ETFs) attracted about $9.1 million in net inflows on Aug. 26, led by Morgan Stanley’s MSOL. SoSoV...

XRP Price Prediction: Korea and Binance Power the Rally, But Can XRP Keep Going?
XRP is trading at a $1.40 price range after a run that saw the token outperform every other top-10 crypto asset by a wide predicti...

Bitcoin (BTC) Price Prediction: Hidden Weekly RSI Divergence Warns of Pullback as BTC Tests $80K
Bitcoin price was trading around $80,500 on Bitstamp in the latest technical reading, up 3.11% on the session. While the price rem...
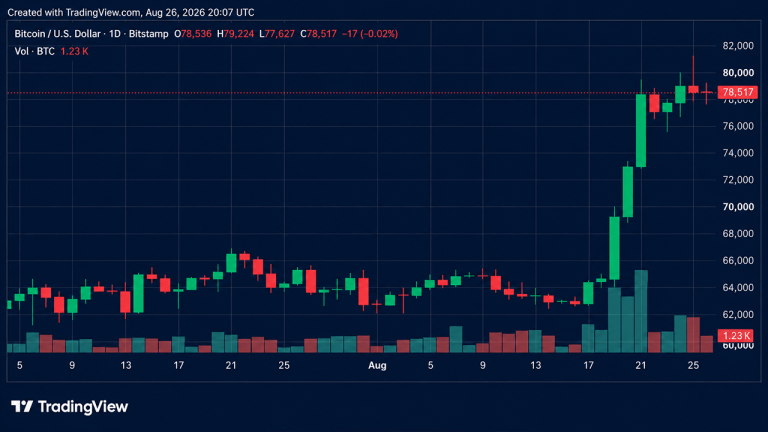
Bitcoin Price Slams Into $79K Wall as Rally Momentum Starts Fading
Bitcoin’s struggle to maintain momentum, which has seen its price climb by more than 20% since Aug. 17, continued Wednesday as the...
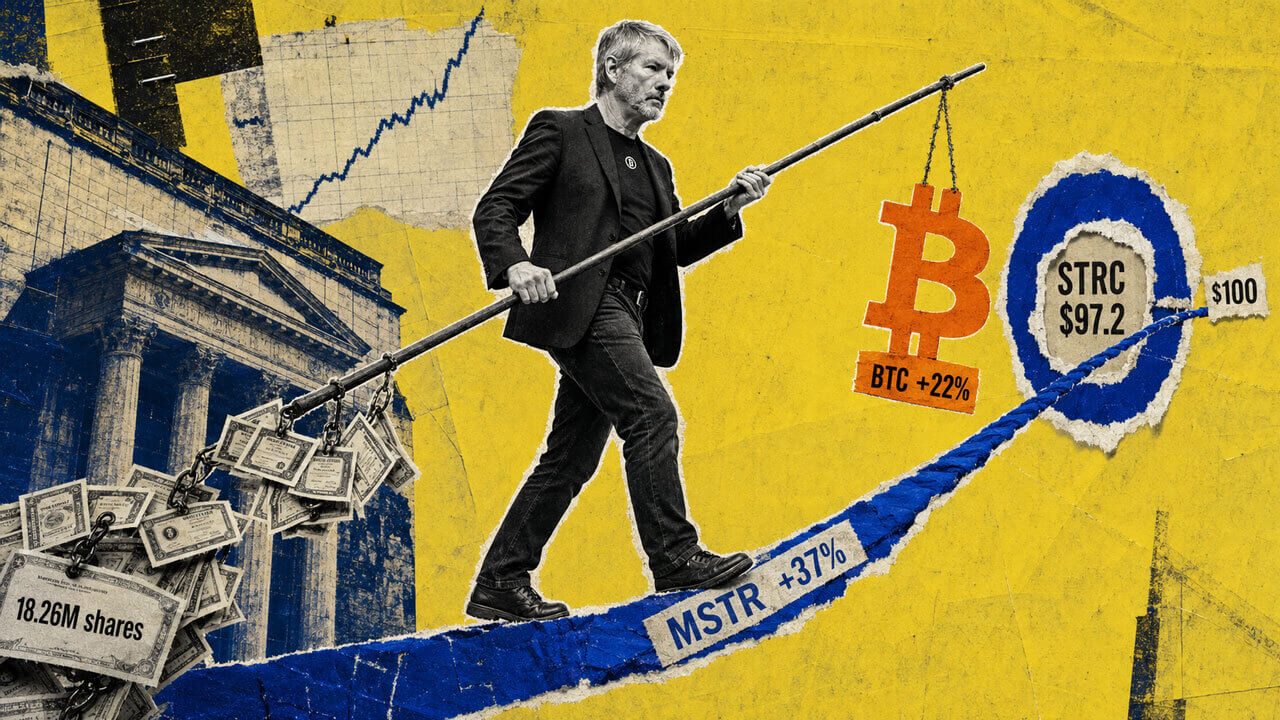
Strategy’s MSTR quietly outperforms Bitcoin’s $80,000 rally as STRC closes in on $100
Bitcoin's sharp two-week recovery, which briefly pushed its value above $80,000, has brought Michael Saylor's Strategy BTC treasur...

Ripple Gets Mastercard Boost as XRP ETF Makes Major Changes
Mastercard deepens its ties to the Ripple ecosystem right as XRP ETF flows show signs of life again. The token is still nowhere ne...