Ripple (XRP) Range-Bound Struggle: Will It Break Free?
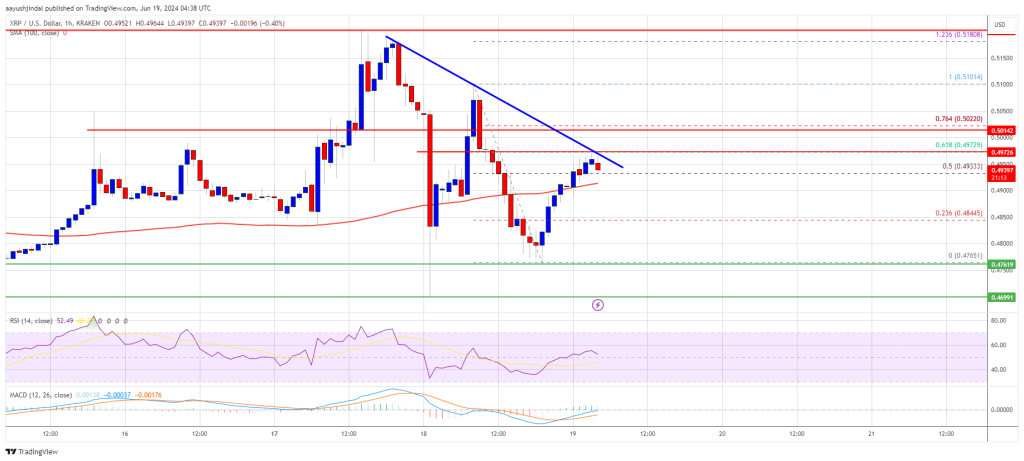
XRP price is struggling to gain bullish momentum above $0.50. The price must settle above $0.50 and $0.520 to start a steady increase in the near term. XRP price extended losses before it found support near the $0.4765 z...

XRP price is struggling to gain bullish momentum above $0.50. The price must settle above $0.50 and $0.520 to start a steady increase in the near term.
- XRP price extended losses before it found support near the $0.4765 zone.
- The price is now trading above $0.4850 and the 100-hourly Simple Moving Average.
- There is a key bearish trend line forming with resistance at $0.4980 on the hourly chart of the XRP/USD pair (data source from Kraken).
- The pair could start a decent increase if it settles above the $0.50 resistance zone.
XRP price failed to start a fresh increase and again reacted to the downside like Bitcoin. There was a move below the $0.4800 level, but the bulls were active near the $0.4765 level.
A low was formed at $0.4765 and the price is now correcting losses. There was a move above the $0.4850 and $0.4900 resistance levels. The bulls pushed the price above the 50% Fib retracement level of the downward move from the $0.5104 swing high to the $0.4765 low.
It is now trading above $0.4850 and the 100-hourly Simple Moving Average. On the upside, the price is facing resistance near the $0.4980 level and the 61.8% Fib retracement level of the downward move from the $0.5104 swing high to the $0.4765 low.
There is also a key bearish trend line forming with resistance at $0.4980 on the hourly chart of the XRP/USD pair. The first key resistance is near $0.500. The next major resistance is near the $0.5020 level.
A close above the $0.5020 resistance zone could send the price higher. The next key resistance is near $0.5200. If there is a clear move above the $0.520 resistance level, there could be a steady increase toward the $0.5320 resistance. Any more gains might send the price toward the $0.5500 resistance.
Another Drop?If XRP fails to clear the $0.4980 resistance zone, it could start another decline. Initial support on the downside is near the $0.490 level and the 100-hourly Simple Moving Average.
The next major support is at $0.4850. If there is a downside break and a close below the $0.4850 level, the price might gain bearish momentum. In the stated case, the price could even trade below the $0.4765 low in the near term.
Technical Indicators
Hourly MACD – The MACD for XRP/USD is now losing pace in the bearish zone.
Hourly RSI (Relative Strength Index) – The RSI for XRP/USD is now above the 50 level.
Major Support Levels – $0.4850 and $0.4765.
Major Resistance Levels – $0.4980 and $0.500.
Original source
Read on NewsBTCRelated market context

Standard Chartered Says Bitcoin Bottomed Near $59,000 As Crypto Winter Ends
TL;DR Standard Chartered’s Geoffrey Kendrick reportedly says Bitcoin’s $59,000 area marked the cycle bottom. The note cites SpaceX...

Google Gemini AI Predicts Jaw-Dropping XRP Price For Next 90 Days
Google Gemini AI just put XRP back under the spotlight, predicting it is tightly wound for a major breakout toward $1.60 to $1.80...

Bitcoin price challenges $64,000 weekend wall – needing a breakout or risk a deeper correction
Bitcoin reclaimed $64,000 on June 12 and touched an intraday high of $64,301 in the same session that spot ETF flows finally flipp...

Elon Musk SpaceX AI Predicts Incredible Bitcoin Price For Next 30 Days
Here is the thing about capitulation calls. They only sound smart in hindsight. Right now, with Bitcoin price scraping along the l...

Bitcoin rises above $64,000 after Pakistan prime minister says Iran peace deal is near
Bitcoin traded above $64,000 on Saturday, supported by its strongest ETF inflows in a month and growing optimism around geopolitic...

Are 24/7 CME Bitcoin futures a volatility cure — or a new leverage trap?
Wall Street got to trade Bitcoin around the clock just in time to watch the market fall apart. CME Group launched 24/7 trading for...