Shiba Inu Gains Momentum: SHIB Price Breaks Above 100-Day Moving Average, What’s Next?
Shiba Inu is gaining momentum as its price breaks above the critical 100-day moving average, a sign that bullish sentiment may be strengthening. This breakout marks an important shift in SHIB’s market structure. Historic...
Archive context
Older archive item. Useful for background and entity history, but not a fresh market-moving signal.

Shiba Inu is gaining momentum as its price breaks above the critical 100-day moving average, a sign that bullish sentiment may be strengthening. This breakout marks an important shift in SHIB’s market structure. Historically, moving averages serve as dynamic support and resistance levels, and reclaiming the 100-day SMA often signals renewed upward potential.
If SHIB can sustain this breakout, it could pave the way for further gains, attracting more bullish interest and potentially triggering a rally toward higher resistance levels. However, traders remain cautious, as maintaining this momentum is key to confirming a trend reversal. Any failure to hold above the moving average may invite renewed selling pressure, leading to a possible retest of support zones.
Market Sentiment Shifts: Are Shiba Inu Buyers Gaining Control?Shiba Inu’s recent price movement above the 100-day moving average suggests a potential shift in market sentiment, with buyers showing renewed interest. Increased trading volume and a steady uptrend indicate that an upside trajectory could be building, challenging the previous dominance of sellers.
SHIB’s price trading above the 100-day SMA signals growing bullish momentum, turning this level into key support. Additionally, the MACD and signal line trending above the zero line reinforce positive sentiment, suggesting buyers are gaining control. If momentum holds, SHIB might sustain its upward move, but overcoming resistance remains crucial.
However, for buyers to fully take control, SHIB must sustain its gains to confirm a stronger uptrend. If the momentum continues, confidence in the market is likely to rise, attracting more investors and fueling further upside.
A decisive breakout above this level, supported by rising trading volume, could strongly confirm bullish strength. Such a move may trigger increased buying pressure, paving the way for an extended rally toward the immediate resistance level at $0.00001703. Additionally, breaking past this resistance could invalidate bearish expectations and set the stage for a potential test of higher resistance zones such as $0.00002045 and $0.00002631.
Support Zones To Watch In Case Of A PullbackShould Shiba Inu face a pullback, key support zones will play a crucial role in determining whether the bullish trend can hold or if bears will take control. The first level to watch is the 100-day SMA, which has now turned into support. SHIB’s maintenance above this level signals strength and renewed buying interest.
However, when selling pressure increases, the next critical support zone lies around $0.00001272, where buyers might attempt to stabilize the price and prevent further downside. A break below this level will bring the price toward $0.00000847 or even lower. Holding above these support zones is essential for SHIB to sustain its bullish outlook and avoid a deeper correction.
Why this matters
This altcoin story adds another data point to the current market tape and is useful when read alongside nearby source coverage.
Original source
Read on NewsBTCRelated market context

Sui (SUI) Price Prediction: ETF Inflows and 100MA Support Strengthen $1.15 Outlook
Recent SUI price action has focused attention on the $0.73-$0.76 area, where several short- and medium-term moving averages are pr...

Bitcoin (BTC) Price Prediction: Hidden Weekly RSI Divergence Warns of Pullback as BTC Tests $80K
Bitcoin price was trading around $80,500 on Bitstamp in the latest technical reading, up 3.11% on the session. While the price rem...
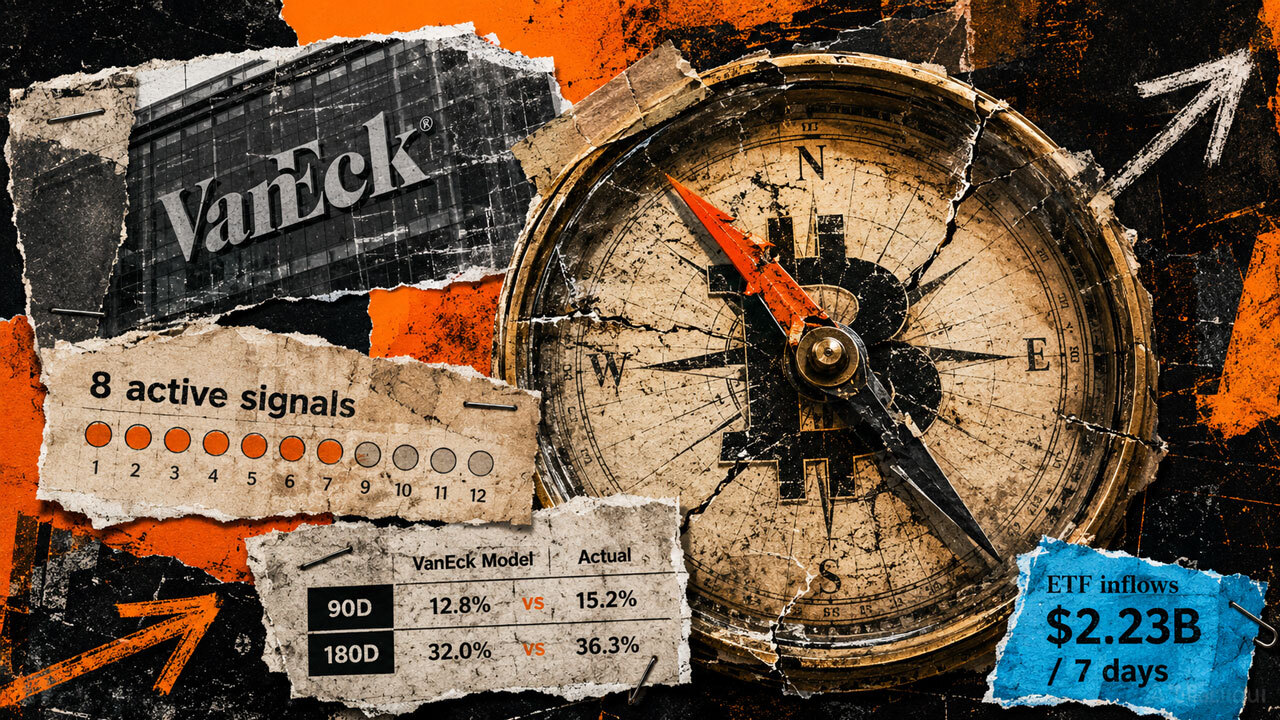
Bitcoin’s bottom signal is flashing, but six months of data shows a trap waiting for early buyers
Bitcoin’s late-August recovery has unfolded in stages. Days prior to the Aug. 19 pump, VanEck’s capitulation dashboard showed broa...

Bitcoin’s failed $81,000 breakout just put $75,000 back on the table
Bitcoin trades near $78,000 heading into the weekend, sitting almost between $77,000 support and $80,000 resistance after a sharp...

XRP Price Prediction: Momentum and $1.40 Floor to Hold
XRP price trades around the $1.40 to $1.45 range, down from the recent $1.70 peak as the token digests one of its sharpest weekly...

Bitcoin Price Prediction: Can BTC Get Back Over $80,000?
Today’s Bitcoin price prediction has BTC trading at $79,500, up around +1.1% over the past 24 hours, as the coin’s late-August gri...