SOL Price Prediction: Why Solana Could Surge 25% Above This Key Hurdle
Solana is correcting gains from the $25 resistance against the US Dollar. SOL price remains supported and might aim for a fresh rally toward $30. SOL price started a downside correction after it failed to clear the $25 r...
Archive context
Older archive item. Useful for background and entity history, but not a fresh market-moving signal.

Solana is correcting gains from the $25 resistance against the US Dollar. SOL price remains supported and might aim for a fresh rally toward $30.
- SOL price started a downside correction after it failed to clear the $25 resistance against the US Dollar.
- The price is now trading above $23.00 and the 100 simple moving average (4 hours).
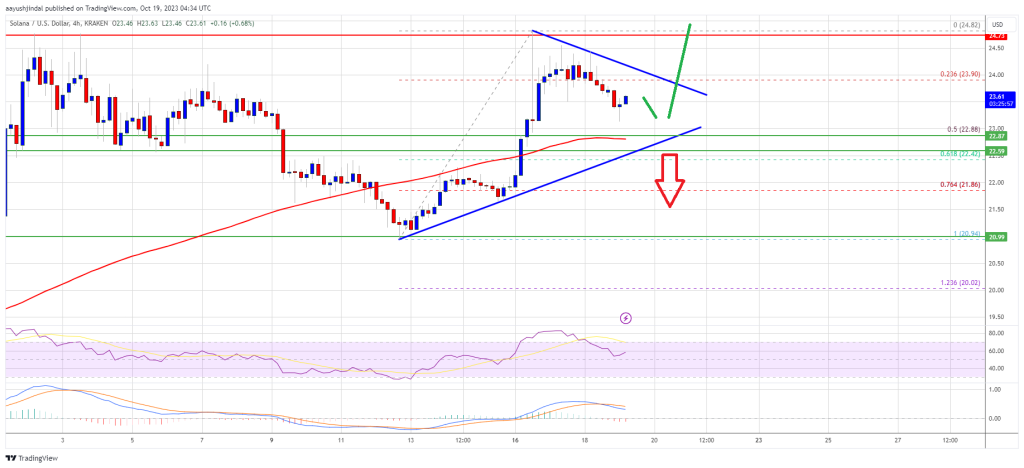
- There is a key contracting triangle forming with resistance near $23.90 on the 4-hour chart of the SOL/USD pair (data source from Kraken).
- The pair could start a strong rally if it clears the $24 and $25 resistance levels.
After a steady increase, Solana struggled to clear the $25 resistance zone. SOL formed a high at $24.82 and recently started a downside correction, like Bitcoin.
There was a move below the $24.20 and $22.00 levels. The bears pushed the price below the 23.6% Fib retracement level of the upward move from the $20.94 swing low to the $24.82 high. There is also a key contracting triangle forming with resistance near $23.90 on the 4-hour chart of the SOL/USD pair.
SOL is now trading above $23.00 and the 100 simple moving average (4 hours). It is now showing positive signs and remains supported above the $22.00 pivot level.
Source: SOLUSD on TradingView.com
On the upside, immediate resistance is near the $24.00 level and the triangle region. The first major resistance is near the $24.00 level. The main resistance is still near the $25.00 zone. A successful close above the $25.00 resistance could set the pace for a larger increase. The next key resistance is near $28.50. Any more gains might send the price toward the $30.00 level.
Are Dips Limited in SOL?If SOL fails to recover above the $24.00 resistance, it could continue to move down. Initial support on the downside is near the $22.85 level or the 50% Fib retracement level of the upward move from the $20.94 swing low to the $24.82 high.
The first major support is near the $22.40 level. If there is a close below the $22.40 support, the price could decline toward the $21.80 support. In the stated case, there is a risk of more downsides toward the $20.50 support in the near term.
Technical Indicators
4-Hours MACD – The MACD for SOL/USD is losing pace in the bearish zone.
4-Hours RSI (Relative Strength Index) – The RSI for SOL/USD is above the 50 level.
Major Support Levels – $22.85, and $22.40.
Major Resistance Levels – $23.90, $24.00, and $25.00.
Why this matters
This altcoin story adds another data point to the current market tape and is useful when read alongside nearby source coverage.
Original source
Read on NewsBTCRelated market context

Solana Price Prediction: SOL Holds Near $81 as Breakout Setup Points to $87, but Whale Flows Keep Risk Active
Solana price is back in focus after a sharp recovery pushed SOL towards the $81 area. The move has improved short-term momentum, e...

XRP vs Bitcoin: Investor Says RLUSD Growth and Regulatory Clarity Could Shift Crypto’s Balance of Power
While the claim remains highly ambitious given Bitcoin’s commanding lead in market capitalization, the discussion highlights broad...

Hyperliquid (HYPE) Price Prediction: Symmetrical Triangle Breakout Puts $77 Target Back in Focus
The breakout comes after several sessions of price compression, with HYPE continuing to trade within a broader technical structure...

Bitcoin Rebounds Toward $63,000, But ETF Flows Still Hold The Key
Bitcoin has started the new week with a little more colour on the screen. After sliding through the kind of levels that usually tr...

XRP Price Prediction: SuperTrend Buy Signal Meets Shrinking Supply as $1.24 Breakout Comes Into Focus
After a fresh SuperTrend buy signal appeared on the 4-hour chart, analysts are watching whether the XRP price can extend its recen...

JP Morgan Warns of New Bitcoin Sell Pressure From Strategy While XRP AI Transactions Approach 1 Million
Although the two developments are unrelated, they illustrate how Bitcoin’s institutional investment narrative and XRP’s expanding...