SOL Price Rallies Over 50% In Few Days But Uptrend Is Far From Over
Solana rallied above the $60 resistance against the US Dollar. SOL price is up over 50% in a few days and might continue to rise toward the $75 level. SOL price started a major rally above the $55 resistance against the...
Archive context
Older archive item. Useful for background and entity history, but not a fresh market-moving signal.

Solana rallied above the $60 resistance against the US Dollar. SOL price is up over 50% in a few days and might continue to rise toward the $75 level.
- SOL price started a major rally above the $55 resistance against the US Dollar.
- The price is now trading above $60 and the 100 simple moving average (4 hours).
- There is a major bullish trend line forming with support near $55.00 on the 4-hour chart of the SOL/USD pair (data source from Kraken).
- The pair could continue to move up if it clears the $68.00 resistance zone.
In the past few days, Solana saw a major rally above the $50 level. SOL gained bullish momentum after it settled above $50, outperforming Bitcoin and Ethereum.
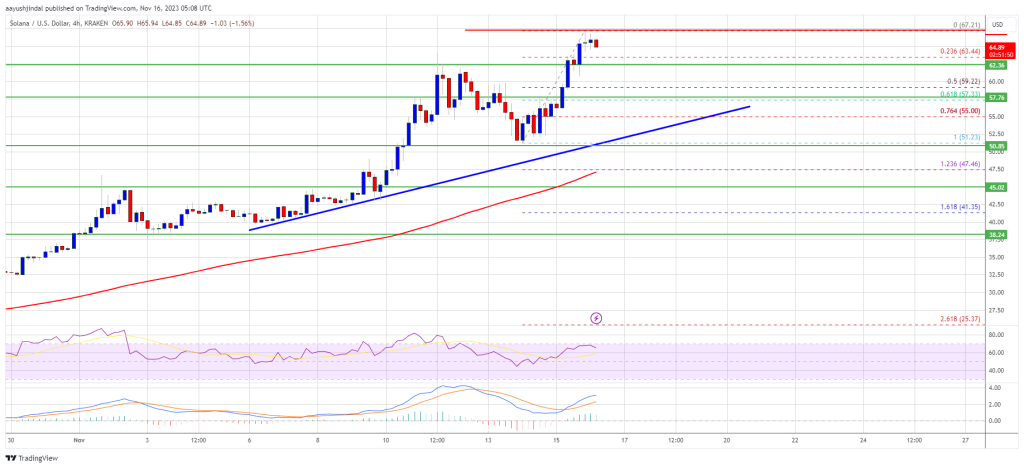
The price is up over 50% in a few days and the bulls are not done yet. The recent move took the price above the $65 level. A high is formed near $67.21 and the price is now consolidating gains. It is showing positive signs above the 23.6% Fib retracement level of the upward move from the $51.23 swing low to the $67.21 high.
SOL is now trading above $60 and the 100 simple moving average (4 hours). There is also a major bullish trend line forming with support near $55.00 on the 4-hour chart of the SOL/USD pair.
Source: SOLUSD on TradingView.com
On the upside, immediate resistance is near the $67.20 level. The first major resistance is near the $68.00 level. A successful close above the $65.00 resistance could set the pace for a larger increase. The next key resistance is near $70.00. Any more gains might send the price toward the $75.00 level.
Are Dips Supported in SOL?If SOL fails to recover above the $68.00 resistance, it could start a downside correction. Initial support on the downside is near the $62.50 level.
The first major support is near the $57.75 level or the 61.8% Fib retracement level of the upward move from the $51.23 swing low to the $67.21 high, below which the price could test the trend line. If there is a close below the $55.00 support, the price could decline toward the $50.00 support in the near term.
Technical Indicators
4-Hours MACD – The MACD for SOL/USD is losing pace in the bullish zone.
4-Hours RSI (Relative Strength Index) – The RSI for SOL/USD is above the 50 level.
Major Support Levels – $62.50, and $57.75.
Major Resistance Levels – $68.00, $70.00, and $75.00.
Why this matters
This altcoin story adds another data point to the current market tape and is useful when read alongside nearby source coverage.
Original source
Read on NewsBTCRelated market context

JP Morgan Warns of New Bitcoin Sell Pressure From Strategy While XRP AI Transactions Approach 1 Million
Although the two developments are unrelated, they illustrate how Bitcoin’s institutional investment narrative and XRP’s expanding...

Bitcoin Rebounds Toward $63,000, But ETF Flows Still Hold The Key
Bitcoin has started the new week with a little more colour on the screen. After sliding through the kind of levels that usually tr...

XRP vs Bitcoin: Investor Says RLUSD Growth and Regulatory Clarity Could Shift Crypto’s Balance of Power
While the claim remains highly ambitious given Bitcoin’s commanding lead in market capitalization, the discussion highlights broad...

XRP Price Prediction: SuperTrend Buy Signal Meets Shrinking Supply as $1.24 Breakout Comes Into Focus
After a fresh SuperTrend buy signal appeared on the 4-hour chart, analysts are watching whether the XRP price can extend its recen...

Mark Zuckerberg’s Meta AI Predicts Unbelievable Bitcoin Price by the End of 2026
Mark Zuckerberg’s Meta AI predicts and stacks 4 numbered catalysts behind its Bitcoin price prediction that puts $120,000 to $150,...

Bitcoin Price Prediction: Saylor’s Strategy is a Risk to Bitcoin, According to JP Morgan
JPMorgan has flagged a structural risk most Bitcoin price prediction bulls haven’t priced in: the same entity driving the most agg...