SOL Price (Solana) Close Below $50 Could Spark Larger Degree Correction
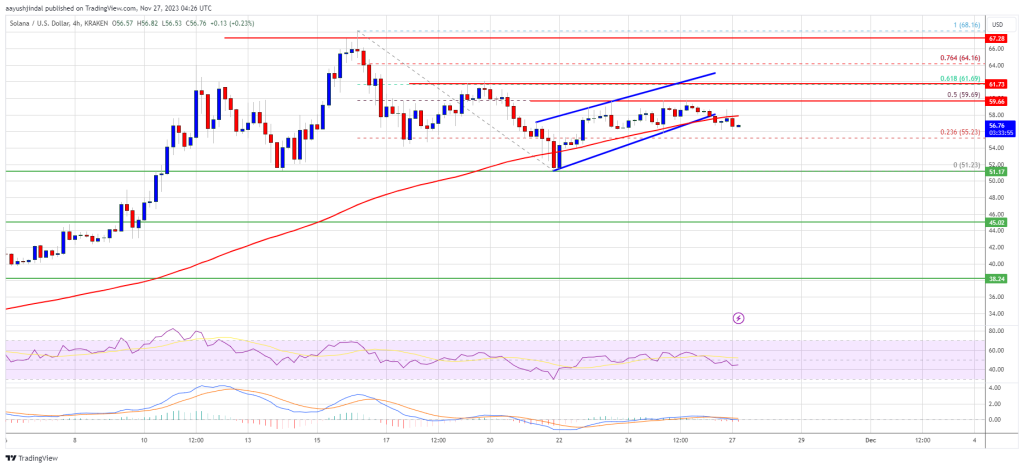
Solana rallied above the $65 resistance against the US Dollar. SOL price is now correcting gains and might even slide below the $50 support. SOL price started a major rally above the $60 resistance before the bears appea...
Archive context
Older archive item. Useful for background and entity history, but not a fresh market-moving signal.

Solana rallied above the $65 resistance against the US Dollar. SOL price is now correcting gains and might even slide below the $50 support.
- SOL price started a major rally above the $60 resistance before the bears appeared against the US Dollar.
- The price is now trading below $60 and the 100 simple moving average (4 hours).
- There was a break below a short-term rising channel with support near $58.00 on the 4-hour chart of the SOL/USD pair (data source from Kraken).
- The pair could accelerate lower below the $55.00 support zone in the coming sessions.
In the past few days, Solana saw a major rally above the $60 level. SOL gained bullish momentum after it settled above $60, outperforming Bitcoin and Ethereum.
The bulls even pumped the price above the $65 level. A high was formed near $68.16 and the price recently saw a downside correction. It traded below $60 and tested $52. A low was formed near $51.23 and the price is now consolidating in a range.
There was a break below a short-term rising channel with support near $58.00 on the 4-hour chart of the SOL/USD pair. SOL is now trading below $60 and the 100 simple moving average (4 hours).
On the upside, immediate resistance is near the $59.50 level. It is close to the 50% Fib retracement level of the downward move from the $68.16 swing high to the $51.23 low. The first major resistance is near the $60.00 level.
Source: SOLUSD on TradingView.com
The main resistance is now near $62 or the 61.8% Fib retracement level of the downward move from the $68.16 swing high to the $51.23 low. A successful close above the $62.00 resistance could set the pace for a larger increase. The next key resistance is near $68.50. Any more gains might send the price toward the $72.00 level.
More Losses in SOL?If SOL fails to recover above the $60.00 resistance, it could continue to move down. Initial support on the downside is near the $55.00 level.
The first major support is near the $51.20 level, below which the price could test $50. If there is a close below the $50 support, the price could decline toward the $45 support in the near term.
Technical Indicators
4-Hours MACD – The MACD for SOL/USD is losing pace in the bullish zone.
4-Hours RSI (Relative Strength Index) – The RSI for SOL/USD is below the 50 level.
Major Support Levels – $55.00, and $51.20.
Major Resistance Levels – $60.00, $62.00, and $68.50.
Why this matters
This altcoin story adds another data point to the current market tape and is useful when read alongside nearby source coverage.
Original source
Read on NewsBTCRelated market context

XRP vs Bitcoin: Investor Says RLUSD Growth and Regulatory Clarity Could Shift Crypto’s Balance of Power
While the claim remains highly ambitious given Bitcoin’s commanding lead in market capitalization, the discussion highlights broad...

Leading Claude AI Fable 5 Predicts Stunning XRP Price by The End of 2026
Anthropic’s new Claude AI model, Fable 5, predicts XRP price for the entire second half around a single event that could be resolv...

XRP Price Prediction: SuperTrend Buy Signal Meets Shrinking Supply as $1.24 Breakout Comes Into Focus
After a fresh SuperTrend buy signal appeared on the 4-hour chart, analysts are watching whether the XRP price can extend its recen...

Mark Zuckerberg’s Meta AI Predicts Unbelievable Bitcoin Price by the End of 2026
Mark Zuckerberg’s Meta AI predicts and stacks 4 numbered catalysts behind its Bitcoin price prediction that puts $120,000 to $150,...

Bitcoin whales send 49,000 BTC to exchanges as $60K rebound shows signs of weakness
Bitcoin’s recovery above $60,000 is facing a fresh test from exchange-flow and derivatives data after large holders moved one of t...

Vitalik Buterin unveils “Lean Ethereum” roadmap for quantum resistance by 2029
Ethereum's proactive roadmap enhances its resilience and appeal, potentially boosting market confidence and investment in its futu...