Solana Price (SOL) Could Spark Another Rally by Clearing $162
Solana started a fresh increase above the $150 resistance. SOL price could rally further if there is a clear move above the $162 resistance. SOL price started a fresh upward move above the $150 and $155 levels the US Dol...

Solana started a fresh increase above the $150 resistance. SOL price could rally further if there is a clear move above the $162 resistance.
- SOL price started a fresh upward move above the $150 and $155 levels the US Dollar.
- The price is now trading above $155 and the 100-hourly simple moving average.
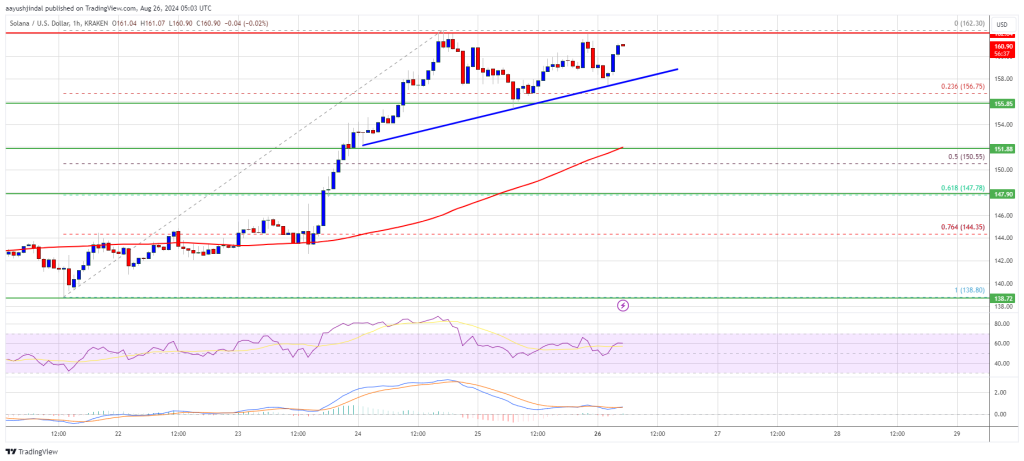
- There is a key bullish trend line forming with support at $158 on the hourly chart of the SOL/USD pair (data source from Kraken).
- The pair could start another increase if it clears the $162 resistance zone.
Solana price started a fresh increase above the $150 resistance level. SOL remained stable and gained pace for a move above the $155 resistance level. It even cleared the $160 resistance level, beating Ethereum and Bitcoin.
The price traded as high as $162 and is currently consolidating gains. There was a minor correction below the $160 level. The price tested the 23.6% Fib retracement level of the upward move from the $138 swing low to the $162 swing high.
Solana is now trading well above $150 and the 100-hourly simple moving average. There is also a key bullish trend line forming with support at $158 on the hourly chart of the SOL/USD pair.
On the upside, the price is facing resistance near the $162 level. The next major resistance is near the $165 level. A successful close above the $162 and $165 resistance levels could set the pace for another steady increase. The next key resistance is near $178. Any more gains might send the price toward the $184 level.
Are Dips Limited in SOL?If SOL fails to rise above the $162 resistance, it could start a downside correction. Initial support on the downside is near the $158 level and the trend line. The first major support is near the $155 level.
A break below the $155 level might send the price toward $148 or the 61.8% Fib retracement level of the upward move from the $138 swing low to the $162 swing high. If there is a close below the $148 support, the price could decline toward the $135 support in the near term.
Technical Indicators
Hourly MACD – The MACD for SOL/USD is gaining pace in the bullish zone.
Hourly Hours RSI (Relative Strength Index) – The RSI for SOL/USD is above the 50 level.
Major Support Levels – $158 and $155.
Major Resistance Levels – $162 and $165.
Original source
Read on NewsBTCRelated market context

Standard Chartered Says Bitcoin Bottomed Near $59,000 As Crypto Winter Ends
TL;DR Standard Chartered’s Geoffrey Kendrick reportedly says Bitcoin’s $59,000 area marked the cycle bottom. The note cites SpaceX...

XRP Price Prediction: Japan XRP ETF Listing is Getting Closer
Japan just handed XRP bulls a major regulatory tailwind. XRP price is retesting a congestion zone, and the prediction could turn b...

Bitcoin rises above $64,000 after Pakistan prime minister says Iran peace deal is near
Bitcoin traded above $64,000 on Saturday, supported by its strongest ETF inflows in a month and growing optimism around geopolitic...

Ethena Commits $250M to Securitize’s STAC as $1.3T CLO Market Expands to Solana
Key Takeaways: Securitize now has its tokenized AAA CLO fund (STAC) extended to Solana. Ethena will contribute $250 million to STA...

Bitcoin price faces new risk as big buyers lose conviction
Bitcoin’s largest buyers are no longer behaving like a reliable backstop for the largest cryptocurrency. The exchange-traded funds...

Elon Musk SpaceX AI Predicts Incredible Bitcoin Price For Next 30 Days
Here is the thing about capitulation calls. They only sound smart in hindsight. Right now, with Bitcoin price scraping along the l...