Solana (SOL) Below $150 Again, Exposing Price to Additional Bearish Swings
Solana started a fresh decline below the $150 zone. SOL price is now consolidating losses below $150 and might decline further below $142. SOL price started a fresh decline below $155 and $150 against the US Dollar. The...

Solana started a fresh decline below the $150 zone. SOL price is now consolidating losses below $150 and might decline further below $142.
- SOL price started a fresh decline below $155 and $150 against the US Dollar.
- The price is now trading below $150 and the 100-hourly simple moving average.
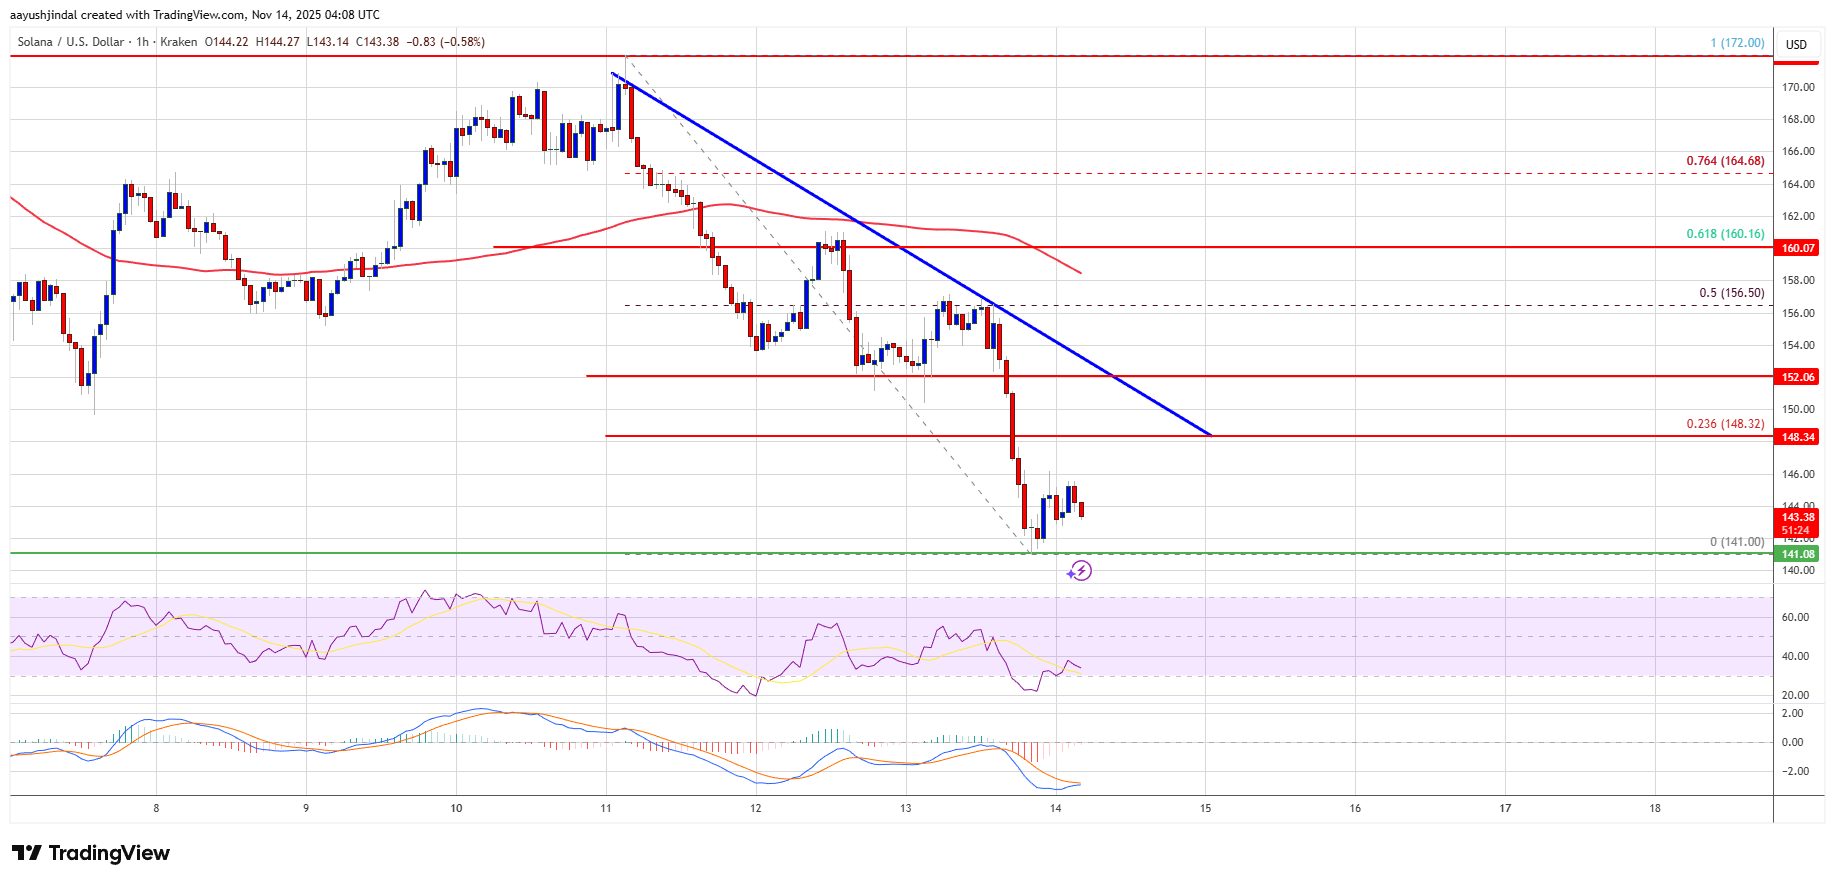
- There is a key bearish trend line forming with resistance at $148 on the hourly chart of the SOL/USD pair (data source from Kraken).
- The price could start a recovery wave if the bulls defend $142 or $140.
Solana price failed to remain stable above $162 and started a fresh decline, like Bitcoin and Ethereum. SOL declined below the $155 and $150 support levels.
The price gained bearish momentum below $150. A low was formed at $141, and the price is now consolidating losses. The price recovered a few points but remained below the 23.6% Fib retracement level of the downward move from the $172 swing high to the $141 low.
Solana is now trading below $150 and the 100-hourly simple moving average. On the upside, immediate resistance is near the $148 level. There is also a key bearish trend line forming with resistance at $148 on the hourly chart of the SOL/USD pair.
The next major resistance is near the $152 level. The main resistance could be $160 and the 61.8% Fib retracement level of the downward move from the $172 swing high to the $141 low. A successful close above the $160 resistance zone could set the pace for another steady increase. The next key resistance is $172. Any more gains might send the price toward the $180 level.
Another Decline In SOL?If SOL fails to rise above the $152 resistance, it could continue to move down. Initial support on the downside is near the $142 zone. The first major support is near the $140 level.
A break below the $140 level might send the price toward the $132 support zone. If there is a close below the $132 support, the price could decline toward the $120 support in the near term.
Technical Indicators
Hourly MACD – The MACD for SOL/USD is gaining pace in the bearish zone.
Hourly Hours RSI (Relative Strength Index) – The RSI for SOL/USD is below the 50 level.
Major Support Levels – $142 and $140.
Major Resistance Levels – $148 and $152.
Original source
Read on NewsBTCRelated market context

Bitcoin (BTC) Price Prediction: BTC Eyes $70K Liquidity Sweep as Whales Reclaim Control Near $62K
Market data suggests that long-term holders remain largely inactive, while whale activity is beginning to recover, creating an int...
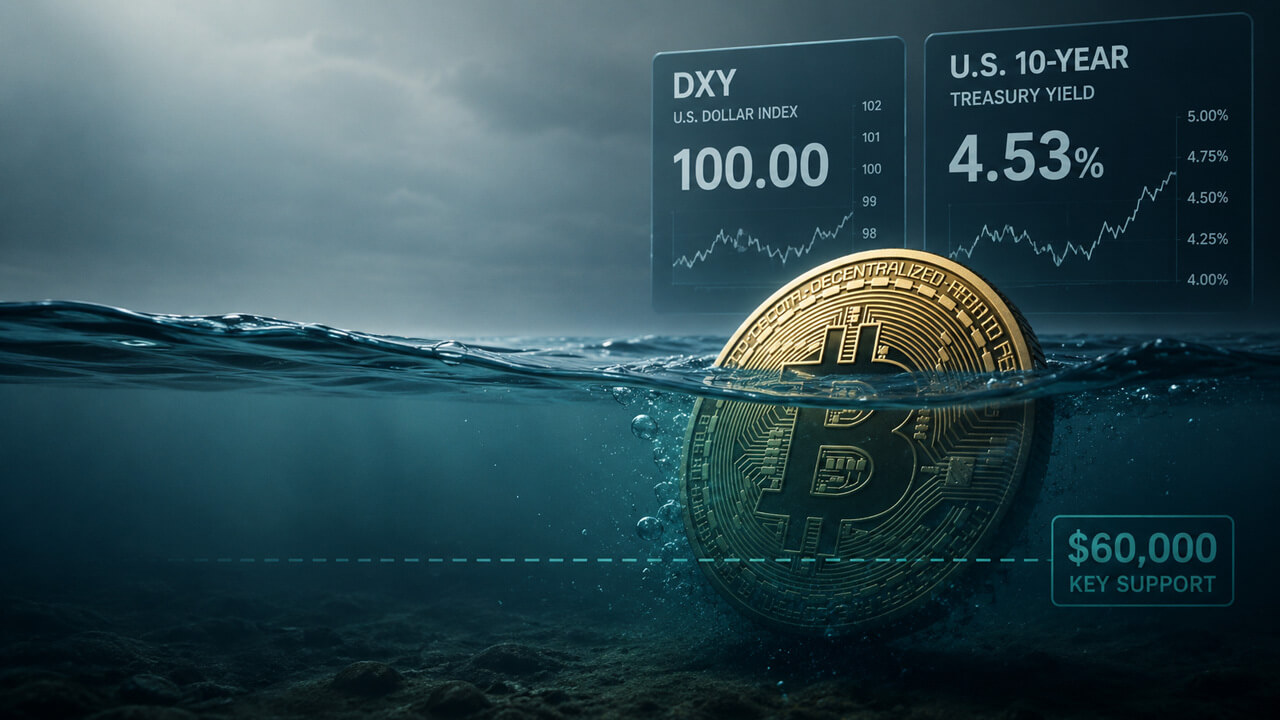
Bitcoin’s $60,000 support is still a bet on the dollar breaking
Glassnode's latest Week On-chain report says Bitcoin has entered a deep discount phase, with over 95% of short-term holders underw...

The 3-Part Impulse That Shows Where The XRP Price Is Headed Next
XRP bulls are trying to turn a brutal selloff into something bigger than a relief bounce. An interesting setup shows a possible th...

XRP Price Prediction: Japan Regulates Crypto like Stocks, XRP to Benefit First
Japan just rewrote the rules. XRP price is battling below resistance at $1.10, but it’s prediction is getting bullish as Japan’s p...

XRP Price Prediction: Japan XRP ETF Listing is Getting Closer
Japan just handed XRP bulls a major regulatory tailwind. XRP price is retesting a congestion zone, and the prediction could turn b...

Ripple chases AI’s machine economy as XRPL stablecoins near $1 billion
Stablecoin liquidity on the XRP Ledger (XRPL) has nearly doubled over the past month, putting the network within reach of a $1 bil...