Solana (SOL) Dips Modestly, But Traders Still Expect Bigger Move
Solana failed to stay above $96 and corrected some gains. SOL price is now consolidating and might aim for another increase above $98. SOL price started a downside correction below $96 against the US Dollar. The price is...
Archive context
Older archive item. Useful for background and entity history, but not a fresh market-moving signal.

Solana failed to stay above $96 and corrected some gains. SOL price is now consolidating and might aim for another increase above $98.
- SOL price started a downside correction below $96 against the US Dollar.
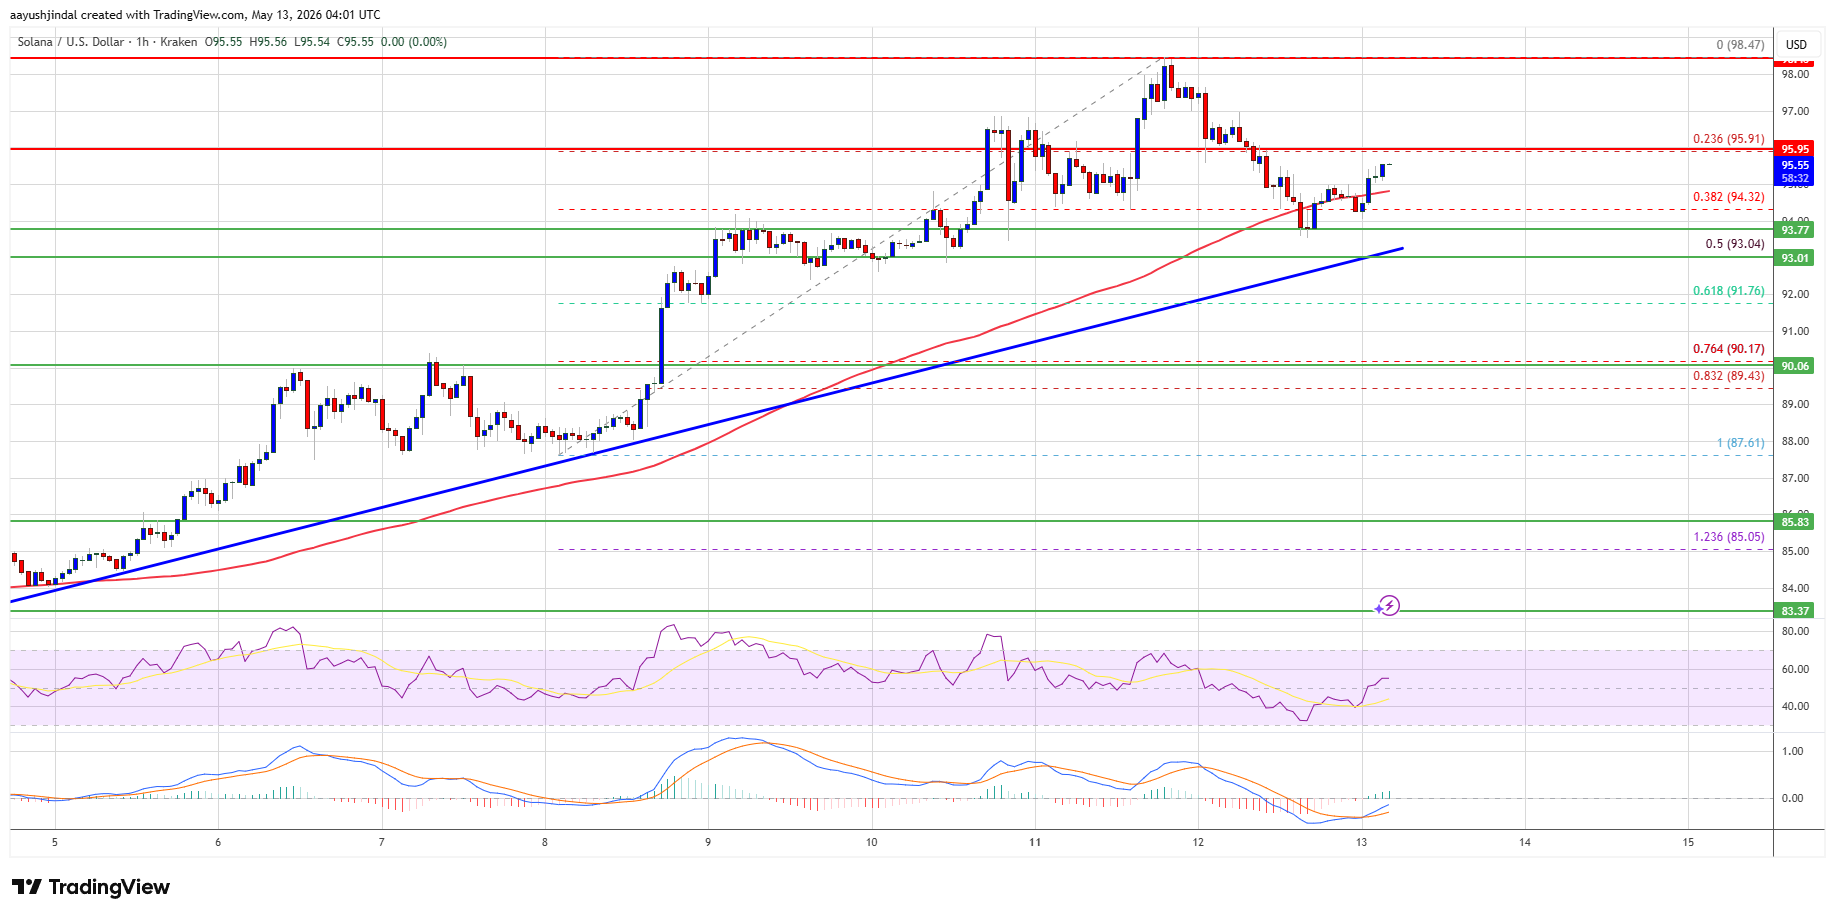
- The price is now trading above $94 and the 100-hourly simple moving average.
- There is a bullish trend line forming with support at $93.00 on the hourly chart of the SOL/USD pair (data source from Kraken).
- The pair could extend losses if it dips below the $92 zone.
Solana price failed to stay above $98 and started a downside correction, like Bitcoin and Ethereum. SOL dipped below $86 and $85 to enter a short-term bearish zone.
There was a move below the 23.6% Fib retracement level of the upward wave from the $87.61 swing low to the $98.47 high. The price even tested the $93.65 support. Besides, there is a bullish trend line forming with support at $93.00 on the hourly chart of the SOL/USD pair.
Solana is now trading above $94 and the 100-hourly simple moving average. On the upside, the price is facing resistance near the $96 level. The next major resistance is near the $98 level. The main resistance could be $102. A successful close above the $102 resistance zone could set the pace for another steady increase. The next key resistance is $105. Any more gains might send the price toward the $112 level.
Downside Break In SOL?If SOL fails to rise above the $96 resistance, it could start another decline. Initial support on the downside is near the $94 zone, the trend line, and the 50% Fib retracement level of the upward wave from the $87.61 swing low to the $98.47 high. The first major support is near the $90 level.
A break below the $90 level might send the price toward the $88 support zone. If there is a close below the $88 support, the price could decline toward the $84 support in the near term.
Technical Indicators
Hourly MACD – The MACD for SOL/USD is gaining pace in the bullish zone.
Hourly Hours RSI (Relative Strength Index) – The RSI for SOL/USD is above the 50 level.
Major Support Levels – $94.00 and $90.00.
Major Resistance Levels – $96.00 and $98.00.
Why this matters
Solana is a tracked market entity in the DigitalMoneyBox archive, making this useful context for readers monitoring repeated mentions and follow-up coverage.
Original source
Read on NewsBTCRelated market context

Ethereum (ETH) Price Prediction: $2,000 or $1,680 Next as ETH Reaches a Critical Turning Point
Ethereum price has fallen back below $1,900 after buyers failed to maintain the latest recovery, leaving ETH positioned between an...

Ethereum Price Prediction: Blackrock Backed Stablecoin to Launch on ETH
Ethereum price is trading near $1,900, but the market may be underestimating a major institutional development that could boost it...
Ethereum just outpaced Bitcoin with $365 million in ETF inflows, but on-chain data shows the real bottom isn’t in yet
Ethereum outpaced Bitcoin in July as stronger investment-product demand and corporate accumulation powered its first sustained rel...

Bitcoin And Ethereum Edge Higher As Traders Watch Altcoin Rotation
Bitcoin and Ethereum edged higher into July 31, while a small shift in market dominance suggested traders were again watching whet...

Bitcoin (BTC) Price Today: Michael Saylor’s Strategy Reports $8.3B Loss as BTC Slides Below $64K
The BTC move comes shortly after Strategy reported an $8.33 billion operating loss for the second quarter of 2026, including an $8...

If Bitcoin breaks $62k over the weekend, a $1.1B short overhang stands ready to pull price down to $60k
Bitcoin enters the weekend near $62,900, less than 1% above the July 31 intraday low, and Deribit has already settled roughly $9.6...