Solana (SOL) Faces Another Rejection, Is A Deeper Correction Ahead?
Solana failed to settle above $90 and extended losses. SOL price is now consolidating losses below $85 and might struggle to start a recovery wave. SOL price started a fresh decline below $88 and $85 against the US Dolla...
Archive context
Older archive item. Useful for background and entity history, but not a fresh market-moving signal.

Solana failed to settle above $90 and extended losses. SOL price is now consolidating losses below $85 and might struggle to start a recovery wave.
- SOL price started a fresh decline below $88 and $85 against the US Dollar.
- The price is now trading below $85 and the 100-hourly simple moving average.
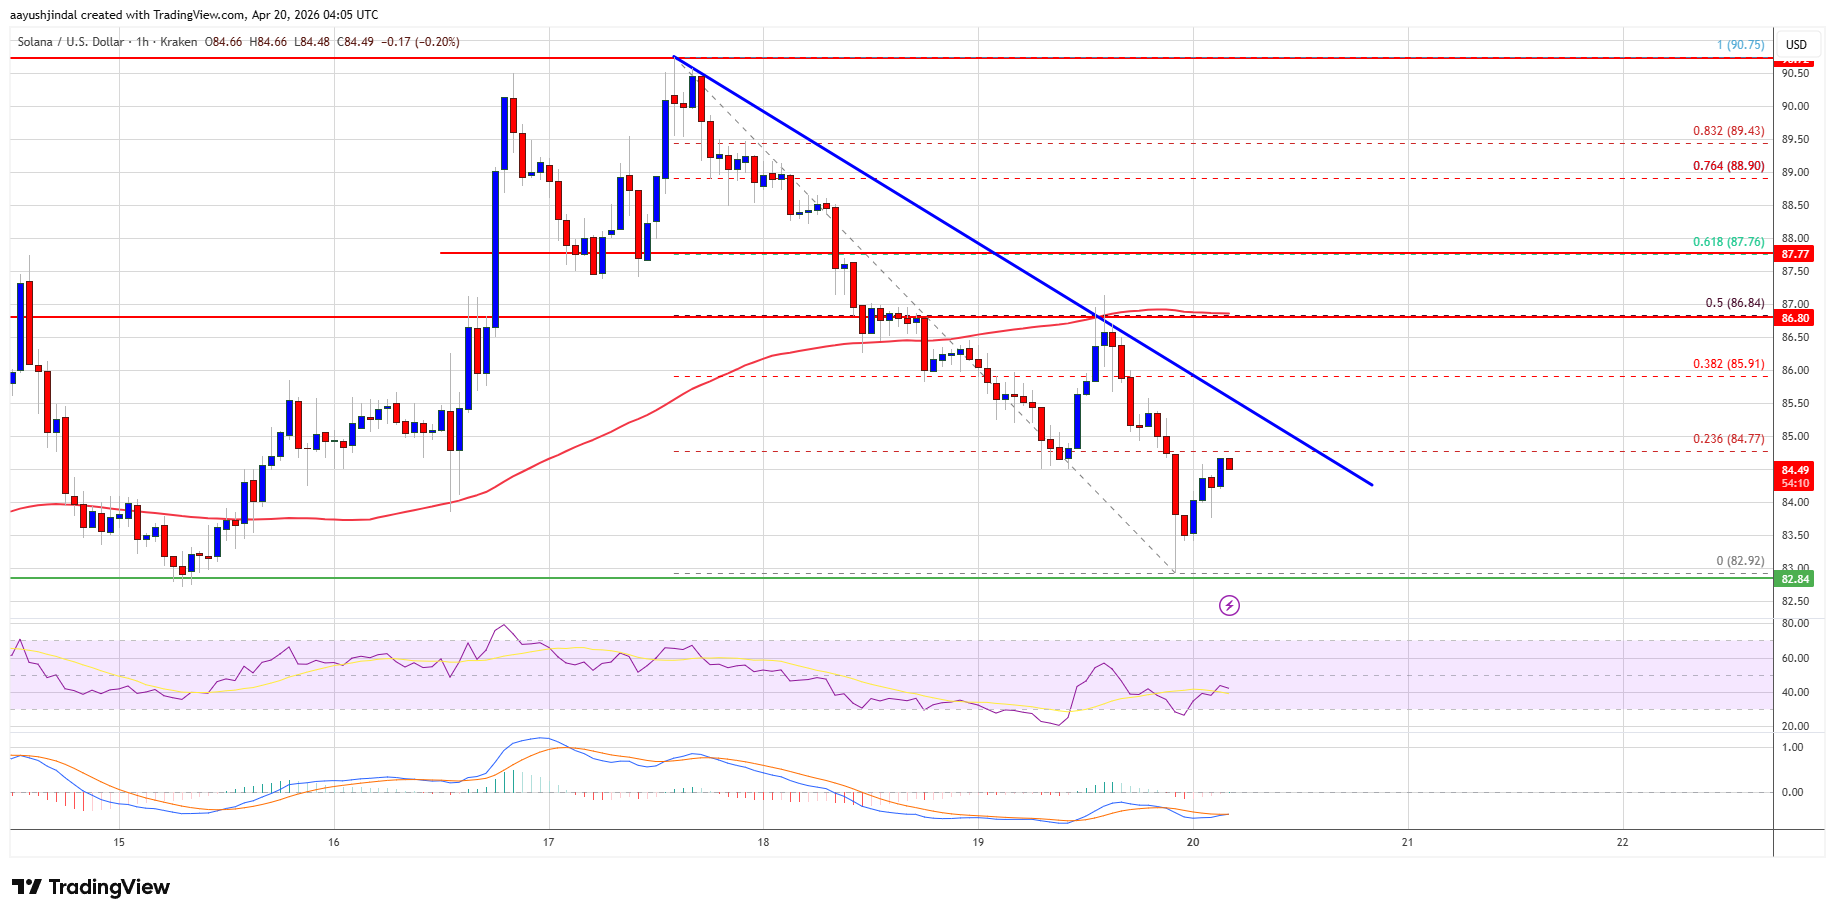
- There is a bearish trend line forming with resistance at $85.50 on the hourly chart of the SOL/USD pair (data source from Kraken).
- The price could start a recovery wave if the bulls defend $82 or $80.
Solana price failed to remain stable above $90 and started a fresh decline, like Bitcoin and Ethereum. SOL declined below the $88 and $86 levels.
The bears even pushed the price toward $82. A low was formed at $82.92, and the price is now consolidating losses below the 23.6% Fib retracement level of the downward move from the $90.75 swing high to the $82.92 low.
Solana is now trading below $86 and the 100-hourly simple moving average. On the upside, immediate resistance is near the $85 level. There is also a bearish trend line forming with resistance at $85.50 on the hourly chart of the SOL/USD pair.
The next major resistance is near the $86.80 level or the 50% Fib retracement level of the downward move from the $90.75 swing high to the $82.92 low. The main resistance could be $88. A successful close above the $88 resistance zone could set the pace for another steady increase. The next key resistance is $90. Any more gains might send the price toward the $92 level.
More Losses In SOL?If SOL fails to rise above the $86.80 resistance, it could continue to move down. Initial support on the downside is near the $82.80 zone. The first major support is near the $82 level.
A break below the $82 level might send the price toward the $80 support zone. If there is a close below the $80 support, the price could decline toward the $76 support in the near term.
Technical Indicators
Hourly MACD – The MACD for SOL/USD is gaining pace in the bearish zone.
Hourly Hours RSI (Relative Strength Index) – The RSI for SOL/USD is below the 50 level.
Major Support Levels – $82 and $80.
Major Resistance Levels – $86.80 and $88.00.
Why this matters
Solana is a tracked market entity in the DigitalMoneyBox archive, making this useful context for readers monitoring repeated mentions and follow-up coverage.
Original source
Read on NewsBTCRelated market context

Ethereum (ETH) Price Prediction: $2,000 or $1,680 Next as ETH Reaches a Critical Turning Point
Ethereum price has fallen back below $1,900 after buyers failed to maintain the latest recovery, leaving ETH positioned between an...

Bitcoin (BTC) Price Today: Michael Saylor’s Strategy Reports $8.3B Loss as BTC Slides Below $64K
The BTC move comes shortly after Strategy reported an $8.33 billion operating loss for the second quarter of 2026, including an $8...
Ethereum just outpaced Bitcoin with $365 million in ETF inflows, but on-chain data shows the real bottom isn’t in yet
Ethereum outpaced Bitcoin in July as stronger investment-product demand and corporate accumulation powered its first sustained rel...

If Bitcoin breaks $62k over the weekend, a $1.1B short overhang stands ready to pull price down to $60k
Bitcoin enters the weekend near $62,900, less than 1% above the July 31 intraday low, and Deribit has already settled roughly $9.6...

Bitcoin And Ethereum Edge Higher As Traders Watch Altcoin Rotation
Bitcoin and Ethereum edged higher into July 31, while a small shift in market dominance suggested traders were again watching whet...

Bitcoin (BTC) Price Prediction: TD Sequential Sell Signal and Weak August History Raise Pullback Risks
The latest market snapshots show Bitcoin trading near $63,000–$64,000, with traders watching whether support around $62,800 can ho...