Solana (SOL) Faces Continued Downside Risk—More Losses Likely
Solana started a fresh decline from the $155 zone. SOL price is now consolidating near $145 and might extend losses below the $142 support. SOL price started a fresh decline below the $150 and $148 levels against the US...
Archive context
Older archive item. Useful for background and entity history, but not a fresh market-moving signal.

Solana started a fresh decline from the $155 zone. SOL price is now consolidating near $145 and might extend losses below the $142 support.
- SOL price started a fresh decline below the $150 and $148 levels against the US Dollar.
- The price is now trading below $150 and the 100-hourly simple moving average.
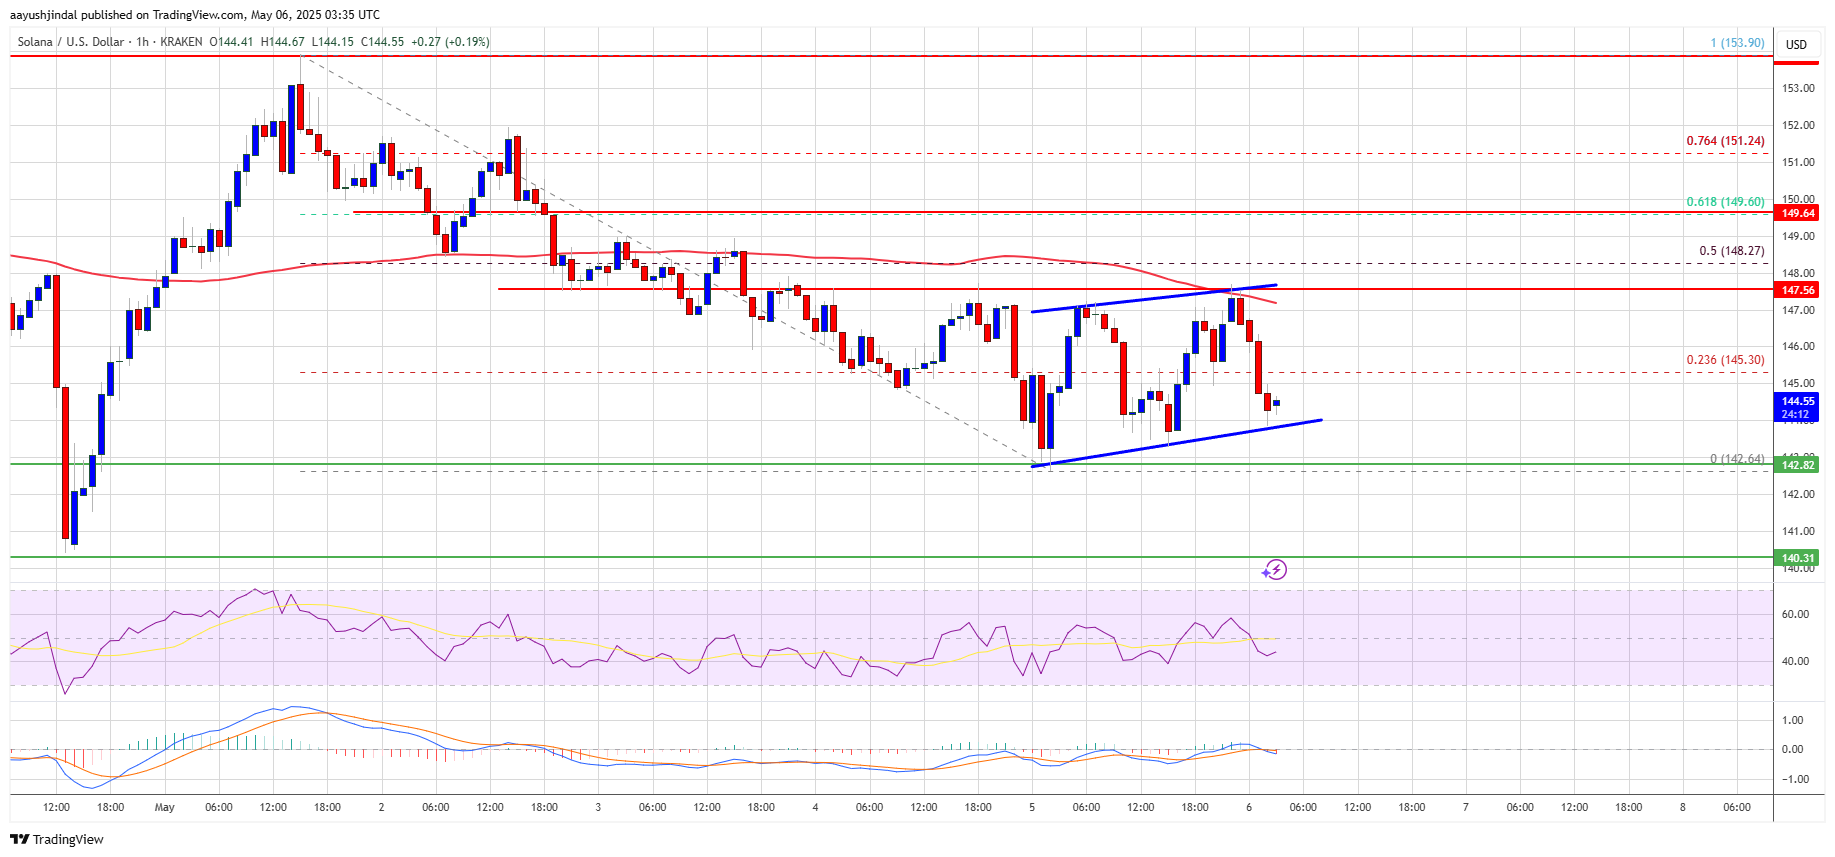
- There is a short-term rising channel or a continuation pattern forming with support at $144 on the hourly chart of the SOL/USD pair (data source from Kraken).
- The pair could start a fresh increase if it clears the $148 resistance zone.
Solana price formed a base above the $142 support and started a fresh increase, like Bitcoin and Ethereum. SOL gained pace for a move above the $145 and $150 resistance levels.
However, the bears were active below the $155 resistance zone. A high was formed at $153.90 and the price started a fresh decline. The price dipped below $150 and $148. A low was formed at $142.64 and the price is now consolidating losses.
There was a minor move above the 23.6% Fib retracement level of the downward move from the $153.90 swing high to the $142.64 low. Solana is now trading below $150 and the 100-hourly simple moving average. There is also a short-term rising channel or a continuation pattern forming with support at $144 on the hourly chart of the SOL/USD pair.
On the upside, the price is facing resistance near the $147 level. The next major resistance is near the $150 level and the 61.8% Fib retracement level of the downward move from the $153.90 swing high to the $142.64 low. The main resistance could be $155. A successful close above the $155 resistance zone could set the pace for another steady increase. The next key resistance is $165. Any more gains might send the price toward the $180 level.
More Losses in SOL?If SOL fails to rise above the $150 resistance, it could start another decline. Initial support on the downside is near the $145 zone. The first major support is near the $142 level.
A break below the $142 level might send the price toward the $135 zone. If there is a close below the $135 support, the price could decline toward the $122 support in the near term.
Technical Indicators
Hourly MACD – The MACD for SOL/USD is gaining pace in the bearish zone.
Hourly Hours RSI (Relative Strength Index) – The RSI for SOL/USD is below the 50 level.
Major Support Levels – $145 and $142.
Major Resistance Levels – $147 and $150.
Why this matters
This altcoin story adds another data point to the current market tape and is useful when read alongside nearby source coverage.
Original source
Read on NewsBTCRelated market context

Bitcoin whales send 49,000 BTC to exchanges as $60K rebound shows signs of weakness
Bitcoin’s recovery above $60,000 is facing a fresh test from exchange-flow and derivatives data after large holders moved one of t...

XRP Price Prediction: SuperTrend Buy Signal Meets Shrinking Supply as $1.24 Breakout Comes Into Focus
After a fresh SuperTrend buy signal appeared on the 4-hour chart, analysts are watching whether the XRP price can extend its recen...

Mark Zuckerberg’s Meta AI Predicts Unbelievable Bitcoin Price by the End of 2026
Mark Zuckerberg’s Meta AI predicts and stacks 4 numbered catalysts behind its Bitcoin price prediction that puts $120,000 to $150,...

Leading Claude AI Fable 5 Predicts Stunning XRP Price by The End of 2026
Anthropic’s new Claude AI model, Fable 5, predicts XRP price for the entire second half around a single event that could be resolv...

Bitcoin Price Prediction: Saylor’s Strategy is a Risk to Bitcoin, According to JP Morgan
JPMorgan has flagged a structural risk most Bitcoin price prediction bulls haven’t priced in: the same entity driving the most agg...
Solana hits usage peak as SOL price climbs above $80
Solana's rising usage and SOL price surge could signal increased investor confidence, potentially influencing broader crypto marke...