Solana (SOL) Fights to Hold $120—Is the Next Move Lower?
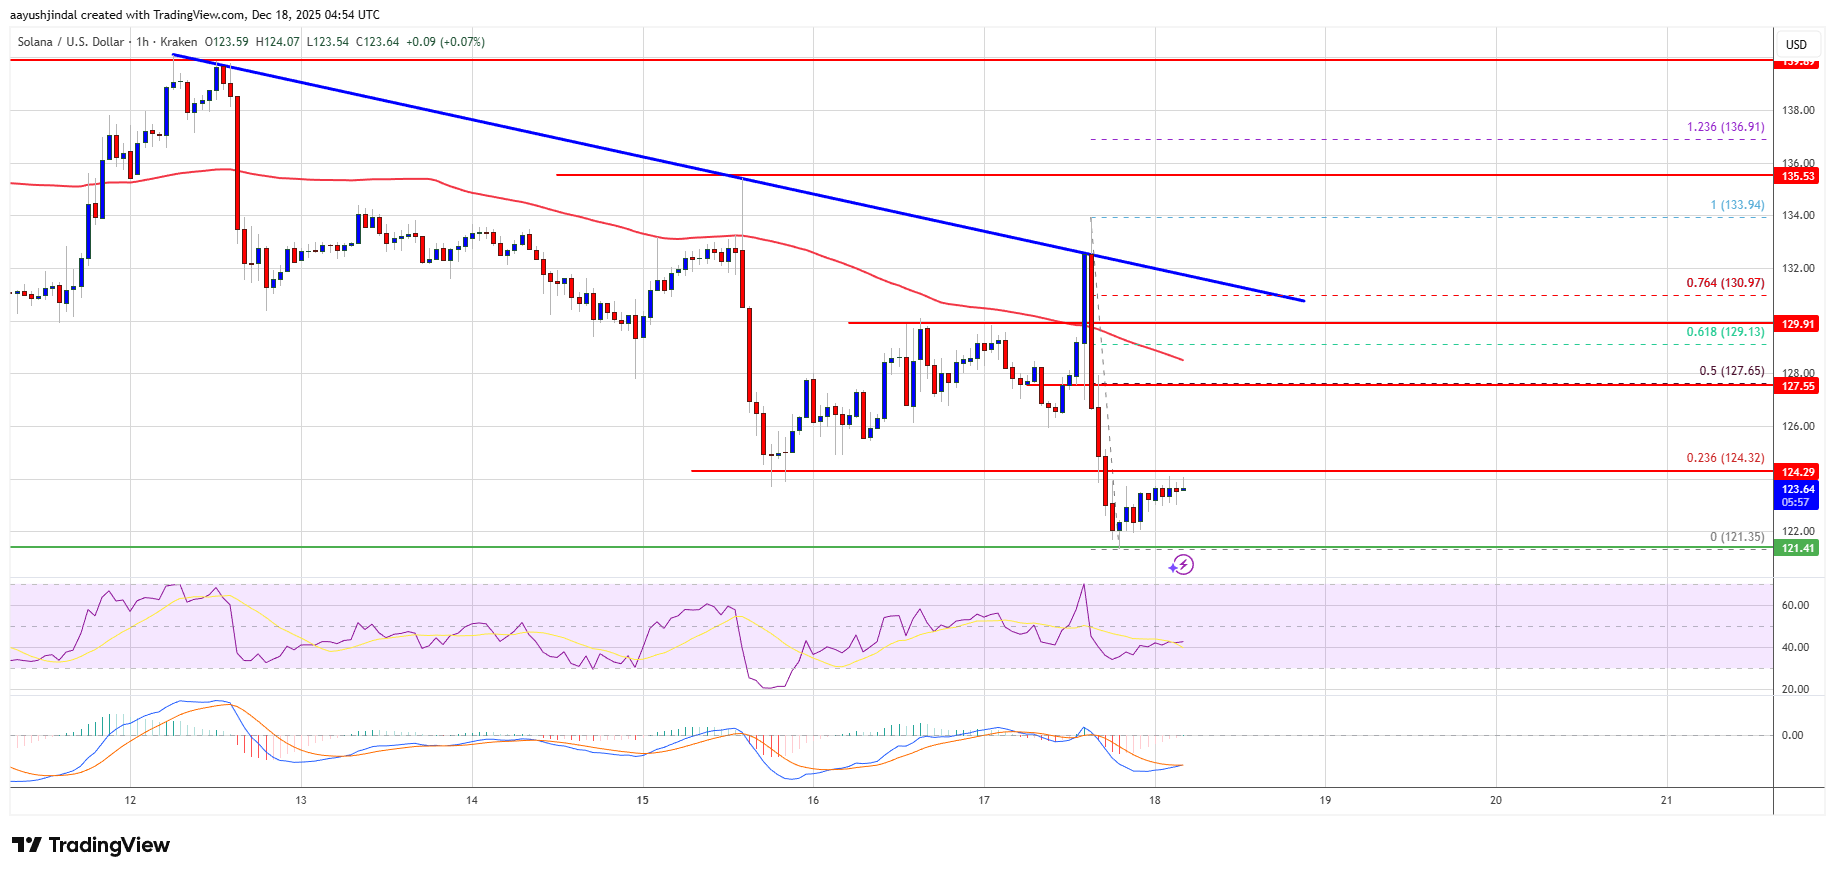
Solana failed to settle above $132 and nosedived. SOL price is now consolidating losses below $130 and might decline further below $120. SOL price started a fresh decline below $130 and $128 against the US Dollar. The pr...

Solana failed to settle above $132 and nosedived. SOL price is now consolidating losses below $130 and might decline further below $120.
- SOL price started a fresh decline below $130 and $128 against the US Dollar.
- The price is now trading below $128 and the 100-hourly simple moving average.
- There is a key bearish trend line forming with resistance at $131 on the hourly chart of the SOL/USD pair (data source from Kraken).
- The price could start a recovery wave if the bulls defend $122 or $120.
Solana price failed to remain stable above $132 and started a fresh decline, like Bitcoin and Ethereum. SOL declined below the $130 and $128 support levels.
The price gained bearish momentum below $126. A low was formed at $121, and the price is now consolidating losses. The price recovered a few points and tested the 23.6% Fib retracement level of the downward move from the $134 swing high to the $121 low.
Solana is now trading below $128 and the 100-hourly simple moving average. On the upside, immediate resistance is near the $125 level. The next major resistance is near the $128 level or the 50% Fib retracement level of the downward move from the $134 swing high to the $121 low.
The main resistance could be $130. There is also a key bearish trend line forming with resistance at $131 on the hourly chart of the SOL/USD pair. A successful close above the $132 resistance zone could set the pace for another steady increase. The next key resistance is $140. Any more gains might send the price toward the $145 level.
Another Decline In SOL?If SOL fails to rise above the $128 resistance, it could continue to move down. Initial support on the downside is near the $122 zone. The first major support is near the $120 level.
A break below the $120 level might send the price toward the $112 support zone. If there is a close below the $112 support, the price could decline toward the $105 support in the near term.
Technical Indicators
Hourly MACD – The MACD for SOL/USD is gaining pace in the bearish zone.
Hourly Hours RSI (Relative Strength Index) – The RSI for SOL/USD is below the 50 level.
Major Support Levels – $122 and $120.
Major Resistance Levels – $128 and $131.
Original source
Read on NewsBTCRelated market context

The 3-Part Impulse That Shows Where The XRP Price Is Headed Next
XRP bulls are trying to turn a brutal selloff into something bigger than a relief bounce. An interesting setup shows a possible th...

XRP Price Prediction: Japan Regulates Crypto like Stocks, XRP to Benefit First
Japan just rewrote the rules. XRP price is battling below resistance at $1.10, but it’s prediction is getting bullish as Japan’s p...

Bitcoin price faces new risk as big buyers lose conviction
Bitcoin’s largest buyers are no longer behaving like a reliable backstop for the largest cryptocurrency. The exchange-traded funds...

XRP Price Prediction: Japan XRP ETF Listing is Getting Closer
Japan just handed XRP bulls a major regulatory tailwind. XRP price is retesting a congestion zone, and the prediction could turn b...

Ripple chases AI’s machine economy as XRPL stablecoins near $1 billion
Stablecoin liquidity on the XRP Ledger (XRPL) has nearly doubled over the past month, putting the network within reach of a $1 bil...

Most Traders Will Scroll Past This Grok AI Bitcoin Predicts, Big Mistake
Elon Musk Grok AI just looked at a Bitcoin chart down more than 50% and predicts it’s a classic accumulation zone, targeting $150,...