Solana (SOL) Grinds Upward as Broader Market Stabilizes — Is a Breakout Brewing?
Solana started a decent upward move above the $165 zone. SOL price is now consolidating and faces hurdles near the $172 zone. SOL price started a decent upward move above $162 and $165 against the US Dollar. The price is...
Solana started a decent upward move above the $165 zone. SOL price is now consolidating and faces hurdles near the $172 zone.
- SOL price started a decent upward move above $162 and $165 against the US Dollar.
- The price is now trading above $165 and the 100-hourly simple moving average.
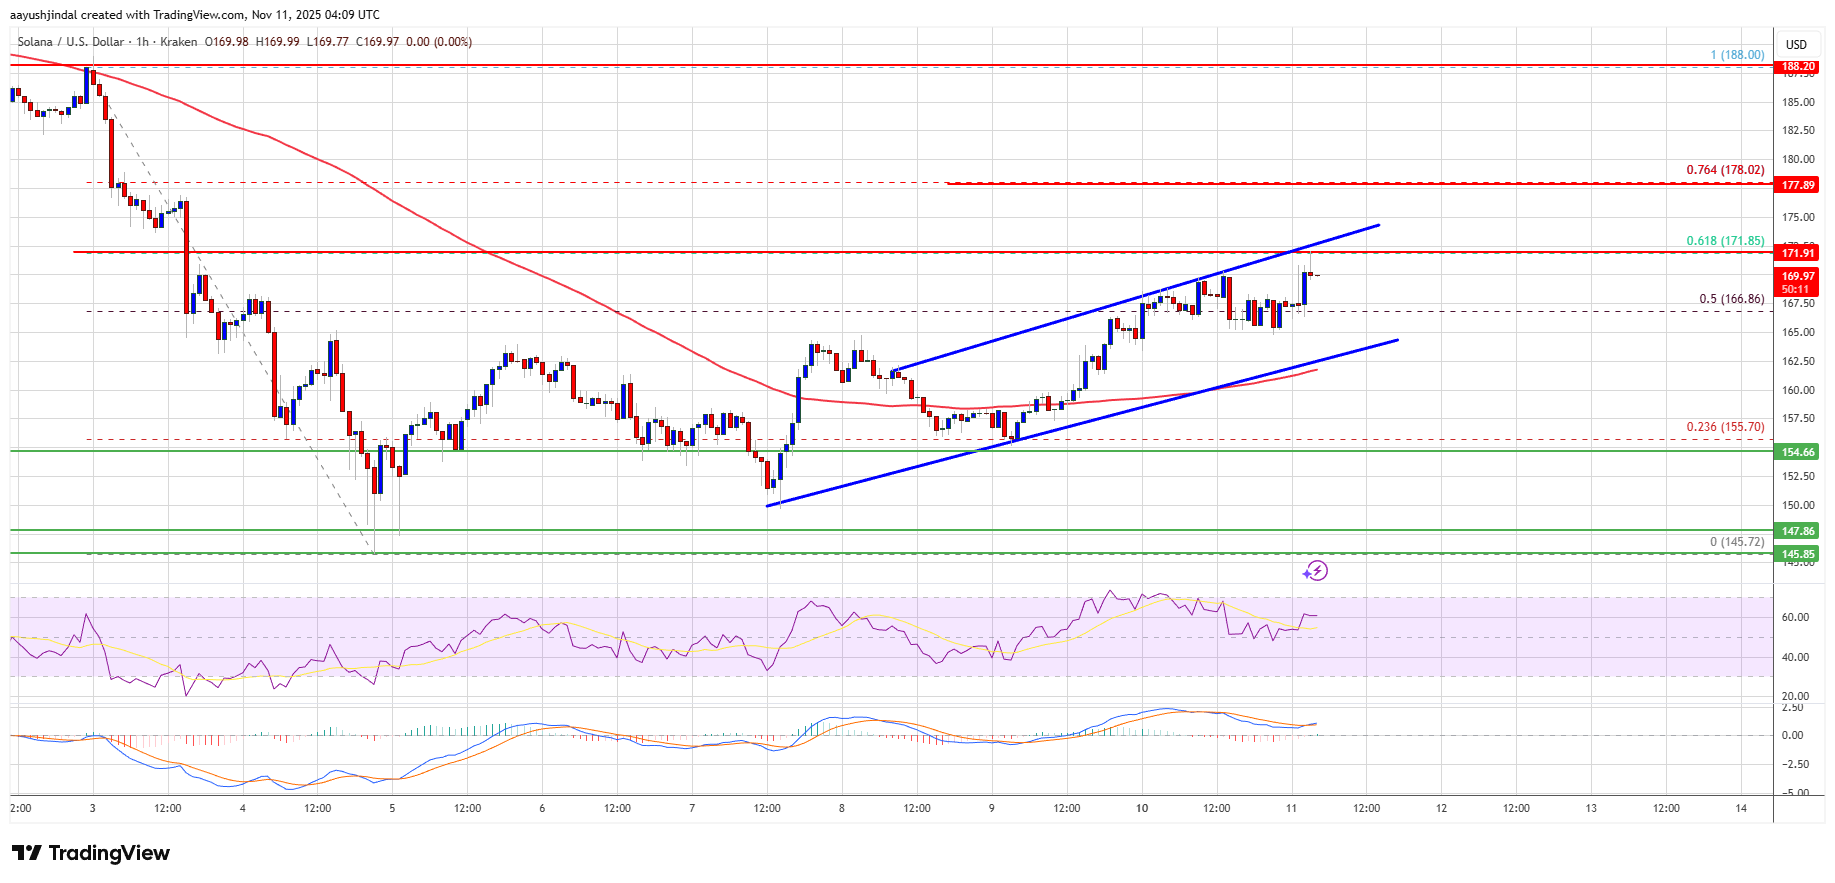
- There is a rising channel forming with resistance at $175 on the hourly chart of the SOL/USD pair (data source from Kraken).
- The price could continue to move up if it clears $172 and $175.
Solana price remained stable and started a decent recovery wave above $155, like Bitcoin and Ethereum. SOL was able to climb above the $162 pivot level.
There was a move above the 50% Fib retracement level of the downward move from the $188 swing high to the $145 low. However, the bears are now active near the $172 resistance zone. There is also a rising channel forming with resistance at $175 on the hourly chart of the SOL/USD pair.
Solana is now trading above $162 and the 100-hourly simple moving average. On the upside, immediate resistance is near the $172 level and the 61.8% Fib retracement level of the downward move from the $188 swing high to the $145 low.
The next major resistance is near the $175 level. The main resistance could be $188. A successful close above the $188 resistance zone could set the pace for another steady increase. The next key resistance is $202. Any more gains might send the price toward the $220 level.
Another Decline In SOL?If SOL fails to rise above the $172 resistance, it could continue to move down. Initial support on the downside is near the $165 zone. The first major support is near the $162 level.
A break below the $162 level might send the price toward the $155 support zone. If there is a close below the $155 support, the price could decline toward the $150 zone in the near term.
Technical Indicators
Hourly MACD – The MACD for SOL/USD is gaining pace in the bullish zone.
Hourly Hours RSI (Relative Strength Index) – The RSI for SOL/USD is above the 50 level.
Major Support Levels – $165 and $162.
Major Resistance Levels – $172 and $175.
Original source
Read on NewsBTCRelated market context

Ethereum Price Prediction: 3 Million ETH Rushes Into Staking as Sellers Vanish
Is nobody leaving Ethereum? A record 36 million ETH is now locked in staking, roughly 29–30% of the circulating supply, and the va...

XRP Price Prediction: Japan XRP ETF Listing is Getting Closer
Japan just handed XRP bulls a major regulatory tailwind. XRP price is retesting a congestion zone, and the prediction could turn b...

XRP Price Prediction: Japan Regulates Crypto like Stocks, XRP to Benefit First
Japan just rewrote the rules. XRP price is battling below resistance at $1.10, but it’s prediction is getting bullish as Japan’s p...

Most Traders Will Scroll Past This Grok AI Bitcoin Predicts, Big Mistake
Elon Musk Grok AI just looked at a Bitcoin chart down more than 50% and predicts it’s a classic accumulation zone, targeting $150,...

Bitcoin price faces new risk as big buyers lose conviction
Bitcoin’s largest buyers are no longer behaving like a reliable backstop for the largest cryptocurrency. The exchange-traded funds...

Ripple chases AI’s machine economy as XRPL stablecoins near $1 billion
Stablecoin liquidity on the XRP Ledger (XRPL) has nearly doubled over the past month, putting the network within reach of a $1 bil...