Solana (SOL) Maintains Strength, Gradual Gains Signal Bullish Bias
Solana failed to stay above $85 and corrected some gains. SOL price is now consolidating and might aim for another increase above $85. SOL price started a downside correction below $84 against the US Dollar. The price is...
Archive context
Older archive item. Useful for background and entity history, but not a fresh market-moving signal.

Solana failed to stay above $85 and corrected some gains. SOL price is now consolidating and might aim for another increase above $85.
- SOL price started a downside correction below $84 against the US Dollar.
- The price is now trading above $82 and the 100-hourly simple moving average.
- There is a bullish trend line forming with support at $82.50 on the hourly chart of the SOL/USD pair (data source from Kraken).
- The pair could extend losses if it dips below the $80 zone.
Solana price failed to stay above $85 and started a downside correction, like Bitcoin and Ethereum. SOL dipped below $84 and $83.50 to enter a short-term bearish zone.
There was a move below the 50% Fib retracement level of the upward wave from the $81.42 swing low to the $85.89 high. The price even tested the $83 support. Besides, there is a bullish trend line forming with support at $82.50 on the hourly chart of the SOL/USD pair.
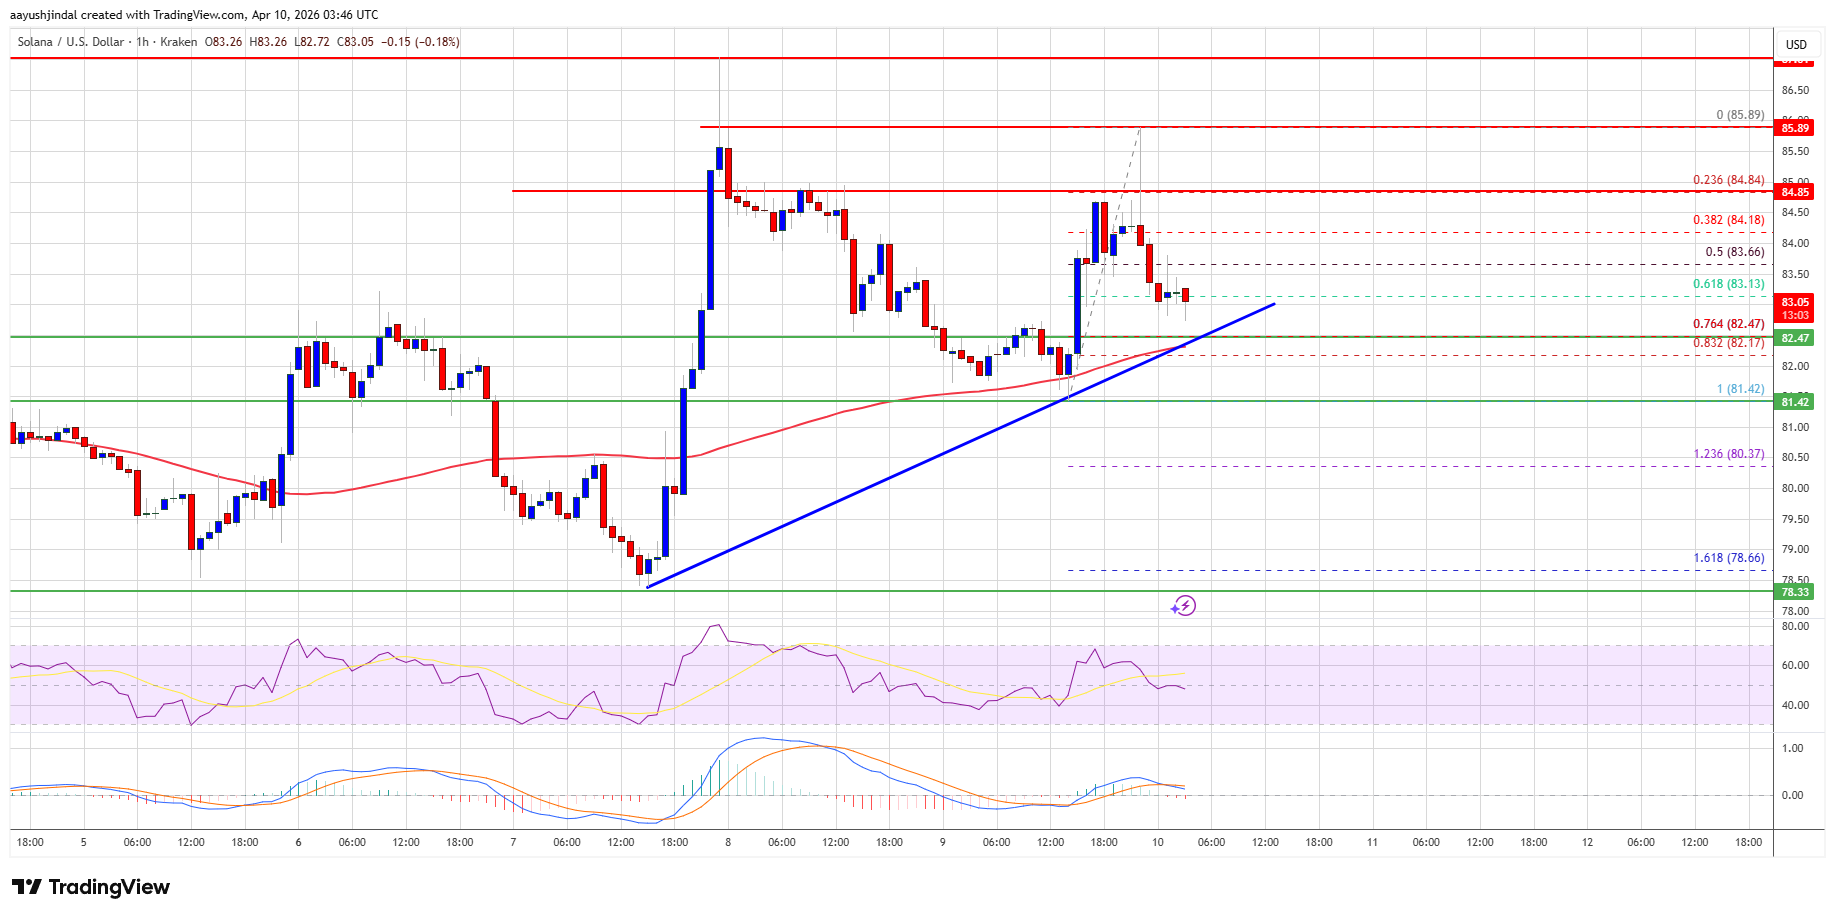
Solana is now trading above $83 and the 100-hourly simple moving average. On the upside, the price is facing resistance near the $84 level. The next major resistance is near the $85 level. The main resistance could be $88. A successful close above the $88 resistance zone could set the pace for another steady increase. The next key resistance is $95. Any more gains might send the price toward the $100 level.
Downside Break In SOL?If SOL fails to rise above the $85 resistance, it could start another decline. Initial support on the downside is near the $82.5 zone, the trend line, and the 76.4% Fib retracement level of the upward wave from the $81.42 swing low to the $85.89 high. The first major support is near the $81.40 level.
A break below the $81.40 level might send the price toward the $80 support zone. If there is a close below the $80 support, the price could decline toward the $76.50 support in the near term.
Technical Indicators
Hourly MACD – The MACD for SOL/USD is losing pace in the bullish zone.
Hourly Hours RSI (Relative Strength Index) – The RSI for SOL/USD is below the 50 level.
Major Support Levels – $82.50 and $80.00.
Major Resistance Levels – $85.00 and $88.00.
Why this matters
Solana is a tracked market entity in the DigitalMoneyBox archive, making this useful context for readers monitoring repeated mentions and follow-up coverage.
Original source
Read on NewsBTCRelated market context

XRP Price Prediction: Ripple’s $700M Escrow Return Puts $1.59 Resistance in the Spotlight
The setup comes shortly after Ripple returned 700 million XRP, worth more than $1 billion, to escrow following its scheduled Octob...

Ethereum Layer 2 Blast Is Shutting Down, Saying Costs Now Exceed What the Chain Earns
Blast, the Ethereum layer 2 network created by Blur founder Tieshun “Pacman” Roquerre, is shutting down, its team announced on X o...

Ethereum Foundation Launches Privacy Tool That Cuts the Link Between AI Prompts and Payers
The Ethereum Foundation has launched zkAPI, a system for paying for AI models and other metered online services without that usage...

Ethereum unstaking queue surges 392% since October start
The surge in Ethereum unstaking highlights potential vulnerabilities in staking infrastructure and could influence future staking...

XRP Price Prediction: Ripple Range-Bound at $1.50, Breakout Soon?
XRP price prediction shows Ripple entering October still trading within a broad range. XRP is currently around $1.50, with key res...

Ethereum Now Lets You Pay for AI Without Revealing Who You Are
Ethereum's zkAPI lets users prepay in USDC and query AI models through cryptographic proofs, so no single party sees both who they...