Solana (SOL) Momentum Explodes as $100 Barrier Comes Into Focus
Solana started a fresh increase above the $92 zone. SOL price is now consolidating near $95 and might aim for more gains above the $98 zone. SOL price started a fresh upward move above the $92 and $95 levels against the...

Solana started a fresh increase above the $92 zone. SOL price is now consolidating near $95 and might aim for more gains above the $98 zone.
- SOL price started a fresh upward move above the $92 and $95 levels against the US Dollar.
- The price is now trading above $92 and the 100-hourly simple moving average.
- There is a bullish trend line forming with support at $94 on the hourly chart of the SOL/USD pair (data source from Kraken).
- The pair could extend gains if it clears the $98 resistance zone.
Solana price started a decent increase after it settled above the $88 zone, like Bitcoin and Ethereum. SOL climbed above the $92 level to enter a short-term positive zone.
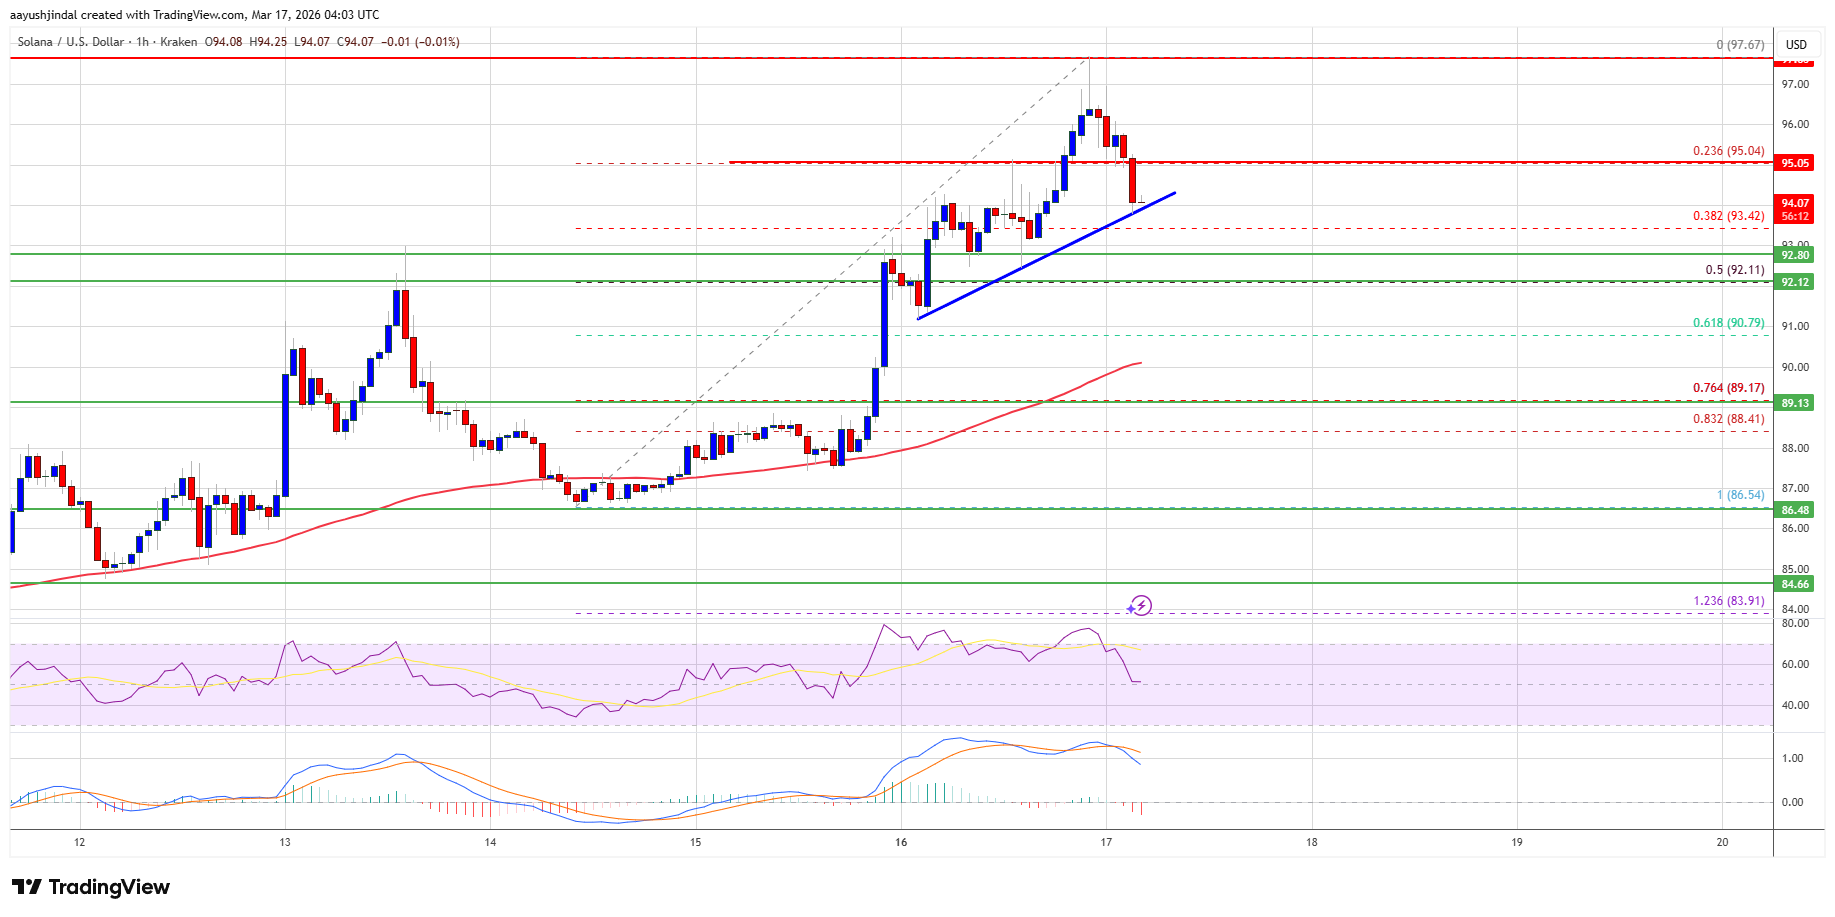
The price even smashed the $95 resistance. A high was formed at $97.67, and the price is now consolidating gains. There was a minor decline below the 23.6% Fib retracement level of the recent upward move from the $86.54 swing low to the $97.67 high.
Solana is now trading above $92 and the 100-hourly simple moving average. Besides, there is a bullish trend line forming with support at $94 on the hourly chart of the SOL/USD pair.
On the upside, the price is facing resistance near $95. The next major resistance is near the $98 level. The main resistance could be $100. A successful close above the $100 resistance zone could set the pace for another steady increase. The next key resistance is $105. Any more gains might send the price toward the $112 level.
Downside Correction In SOL?If SOL fails to rise above the $98 resistance, it could start another decline. Initial support on the downside is near the $94 zone. The first major support is near the $92 level and the 50% Fib retracement level of the recent upward move from the $86.54 swing low to the $97.67 high.
A break below the $92 level might send the price toward the $88 support zone. If there is a close below the $88 support, the price could decline toward the $82 support in the near term.
Technical Indicators
Hourly MACD – The MACD for SOL/USD is losing pace in the bullish zone.
Hourly Hours RSI (Relative Strength Index) – The RSI for SOL/USD is above the 50 level.
Major Support Levels – $94.00 and $92.00
Major Resistance Levels – $95.00 and $98.00.
Original source
Read on NewsBTCRelated market context

Ethereum Price Prediction: 3 Million ETH Rushes Into Staking as Sellers Vanish
Is nobody leaving Ethereum? A record 36 million ETH is now locked in staking, roughly 29–30% of the circulating supply, and the va...

Kraken Adds USDCx Support On Canton As Institutional Stablecoin Rails Expand
TL;DR Kraken says it now supports USDCx deposits and withdrawals on the Canton Network. USDCx is described as a Canton-native stab...

XRP Price Prediction: Japan XRP ETF Listing is Getting Closer
Japan just handed XRP bulls a major regulatory tailwind. XRP price is retesting a congestion zone, and the prediction could turn b...

Kraken Becomes Official Crypto Exchange Supporter Of FIFA World Cup 2026
TL;DR Kraken says it has become the Official Crypto Exchange Supporter of the FIFA World Cup 2026. The tournament expands to 48 te...

XRP aims for $0.90 as ETF demand battles selling pressure from whales
XRP is trading at $1.11, down roughly 17% from its June opening, having set a new 2026 low on June 5 and shed $8 billion in market...

Ripple chases AI’s machine economy as XRPL stablecoins near $1 billion
Stablecoin liquidity on the XRP Ledger (XRPL) has nearly doubled over the past month, putting the network within reach of a $1 bil...