Solana (SOL) Pushes Higher Again – Has It Finally Found Its Short-Term Bottom?
Solana started a fresh increase above the $180 zone. SOL price is now consolidating above $185 and might aim for more gains above the $200 zone. SOL price started a fresh upward move above the $175 and $180 levels agains...

Solana started a fresh increase above the $180 zone. SOL price is now consolidating above $185 and might aim for more gains above the $200 zone.
- SOL price started a fresh upward move above the $175 and $180 levels against the US Dollar.
- The price is now trading below $200 and the 100-hourly simple moving average.
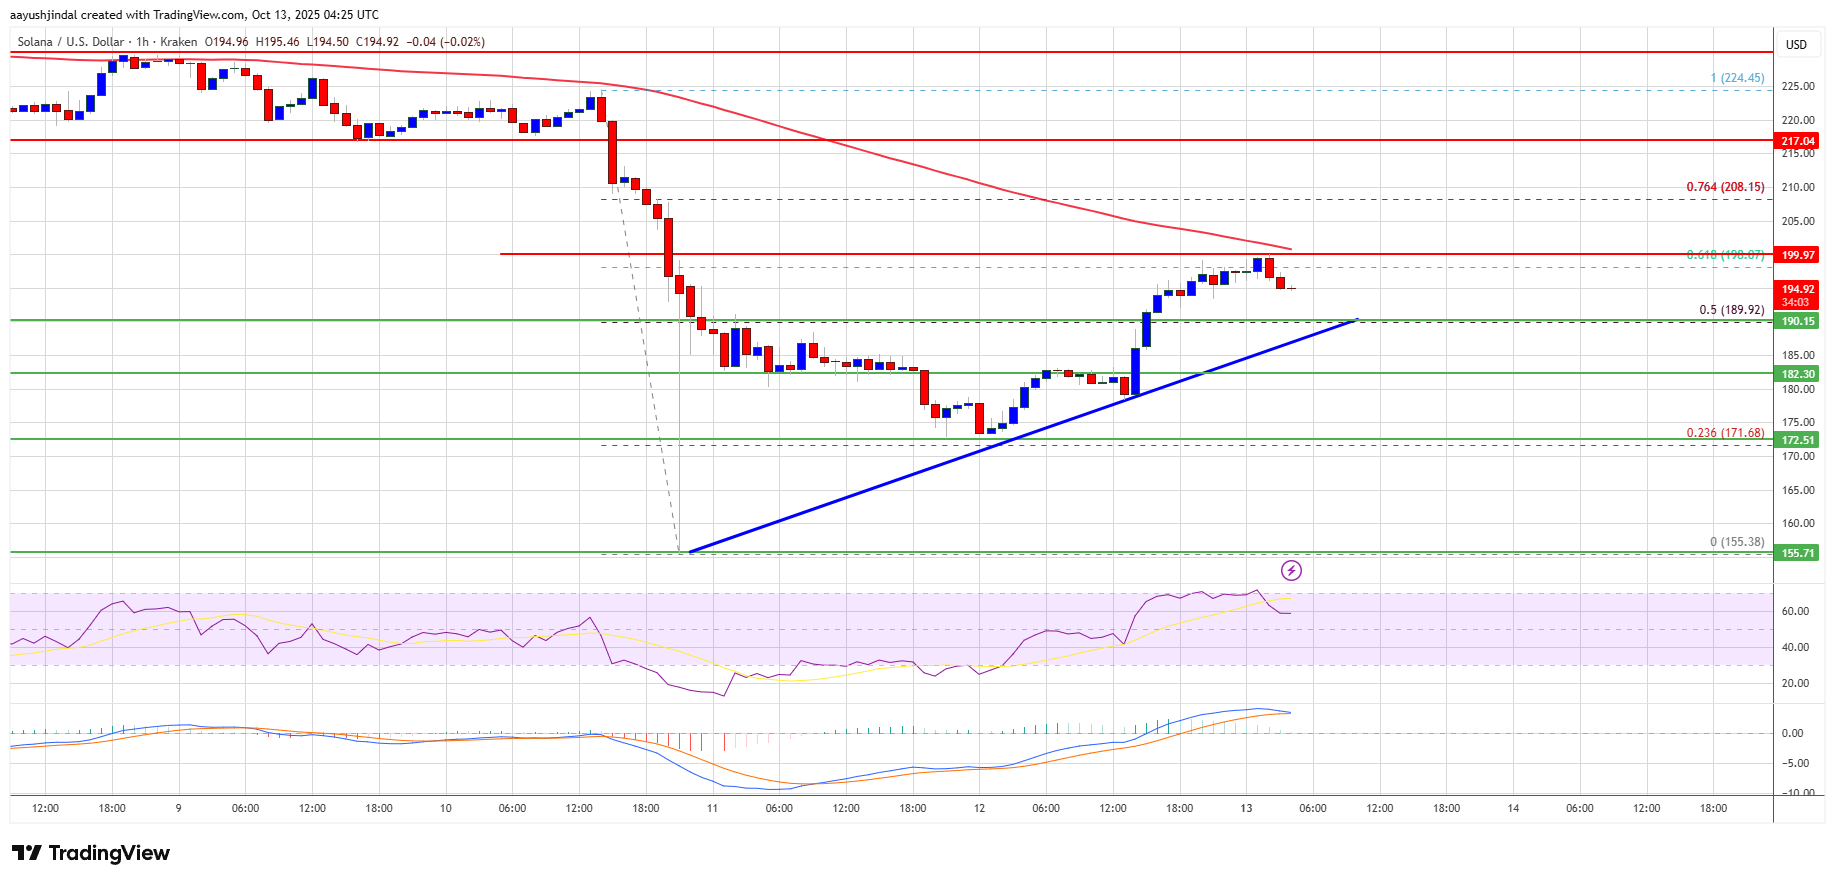
- There is a bullish trend line forming with support at $188 on the hourly chart of the SOL/USD pair (data source from Kraken).
- The pair could extend gains if it clears the $200 resistance zone.
Solana price started a decent increase after it found support near the $155 zone, beating Bitcoin and Ethereum. SOL climbed above the $172 level to enter a short-term positive zone.
The price even smashed the $180 resistance. The bulls were able to push the price above the 50% Fib retracement level of the downward move from the $225 swing high to the $155 low. Besides, there is a bullish trend line forming with support at $188 on the hourly chart of the SOL/USD pair.
Solana is now trading below $200 and the 100-hourly simple moving average. On the upside, the price is facing resistance near the $198 level and the 61.8% Fib retracement level of the downward move from the $225 swing high to the $155 low. The next major resistance is near the $200 level.
The main resistance could be $205. A successful close above the $205 resistance zone could set the pace for another steady increase. The next key resistance is $212. Any more gains might send the price toward the $220 level.
Another Decline In SOL?If SOL fails to rise above the $200 resistance, it could start another decline. Initial support on the downside is near the $190 zone and the trend line. The first major support is near the $182 level.
A break below the $182 level might send the price toward the $175 support zone. If there is a close below the $175 support, the price could decline toward the $160 support in the near term.
Technical Indicators
Hourly MACD – The MACD for SOL/USD is gaining pace in the bullish zone.
Hourly Hours RSI (Relative Strength Index) – The RSI for SOL/USD is above the 50 level.
Major Support Levels – $188 and $182.
Major Resistance Levels – $198 and $200.
Original source
Read on NewsBTCRelated market context

XRP Price Prediction: Japan Regulates Crypto like Stocks, XRP to Benefit First
Japan just rewrote the rules. XRP price is battling below resistance at $1.10, but it’s prediction is getting bullish as Japan’s p...

XRP Price Prediction: Japan XRP ETF Listing is Getting Closer
Japan just handed XRP bulls a major regulatory tailwind. XRP price is retesting a congestion zone, and the prediction could turn b...

Most Traders Will Scroll Past This Grok AI Bitcoin Predicts, Big Mistake
Elon Musk Grok AI just looked at a Bitcoin chart down more than 50% and predicts it’s a classic accumulation zone, targeting $150,...

Ripple chases AI’s machine economy as XRPL stablecoins near $1 billion
Stablecoin liquidity on the XRP Ledger (XRPL) has nearly doubled over the past month, putting the network within reach of a $1 bil...
Bitcoin Price Prediction: JPMorgan Fuds BTC as Debasement Trade Retreat Accelerates
JPMorgan is calling it. The debasement trade, or the macro thesis that drove billions into Bitcoin price and gold, is unwinding, a...

The 3-Part Impulse That Shows Where The XRP Price Is Headed Next
XRP bulls are trying to turn a brutal selloff into something bigger than a relief bounce. An interesting setup shows a possible th...