Solana (SOL) Rebounds Again, Buyers Target Next Upside Leg
Solana found support at $81.40 and corrected some losses. SOL price is now consolidating above $83.50 and might aim for a steady increase. SOL price started a decent recovery wave above $82 and $83.50 against the US Doll...
Archive context
Older archive item. Useful for background and entity history, but not a fresh market-moving signal.

Solana found support at $81.40 and corrected some losses. SOL price is now consolidating above $83.50 and might aim for a steady increase.
- SOL price started a decent recovery wave above $82 and $83.50 against the US Dollar.
- The price is now trading near $84 and the 100-hourly simple moving average.
- There was a break above a bearish trend line with resistance at $83.45 on the hourly chart of the SOL/USD pair (data source from Kraken).
- The price could continue to move up if it clears $84.50 and $85.00.
Solana price remained stable and started a decent recovery wave from $81.40, like Bitcoin and Ethereum. SOL was able to climb above the $82.50 level.
There was a move above the 50% Fib retracement level of the downward move from the $85.48 swing high to the $81.40 low. Besides, there was a break above a bearish trend line with resistance at $83.45 on the hourly chart of the SOL/USD pair.
However, the bears are active below $85.00 and the 76.4% Fib retracement level of the downward move from the $85.48 swing high to the $81.40 low. Solana is now trading near $84 and the 100-hourly simple moving average.
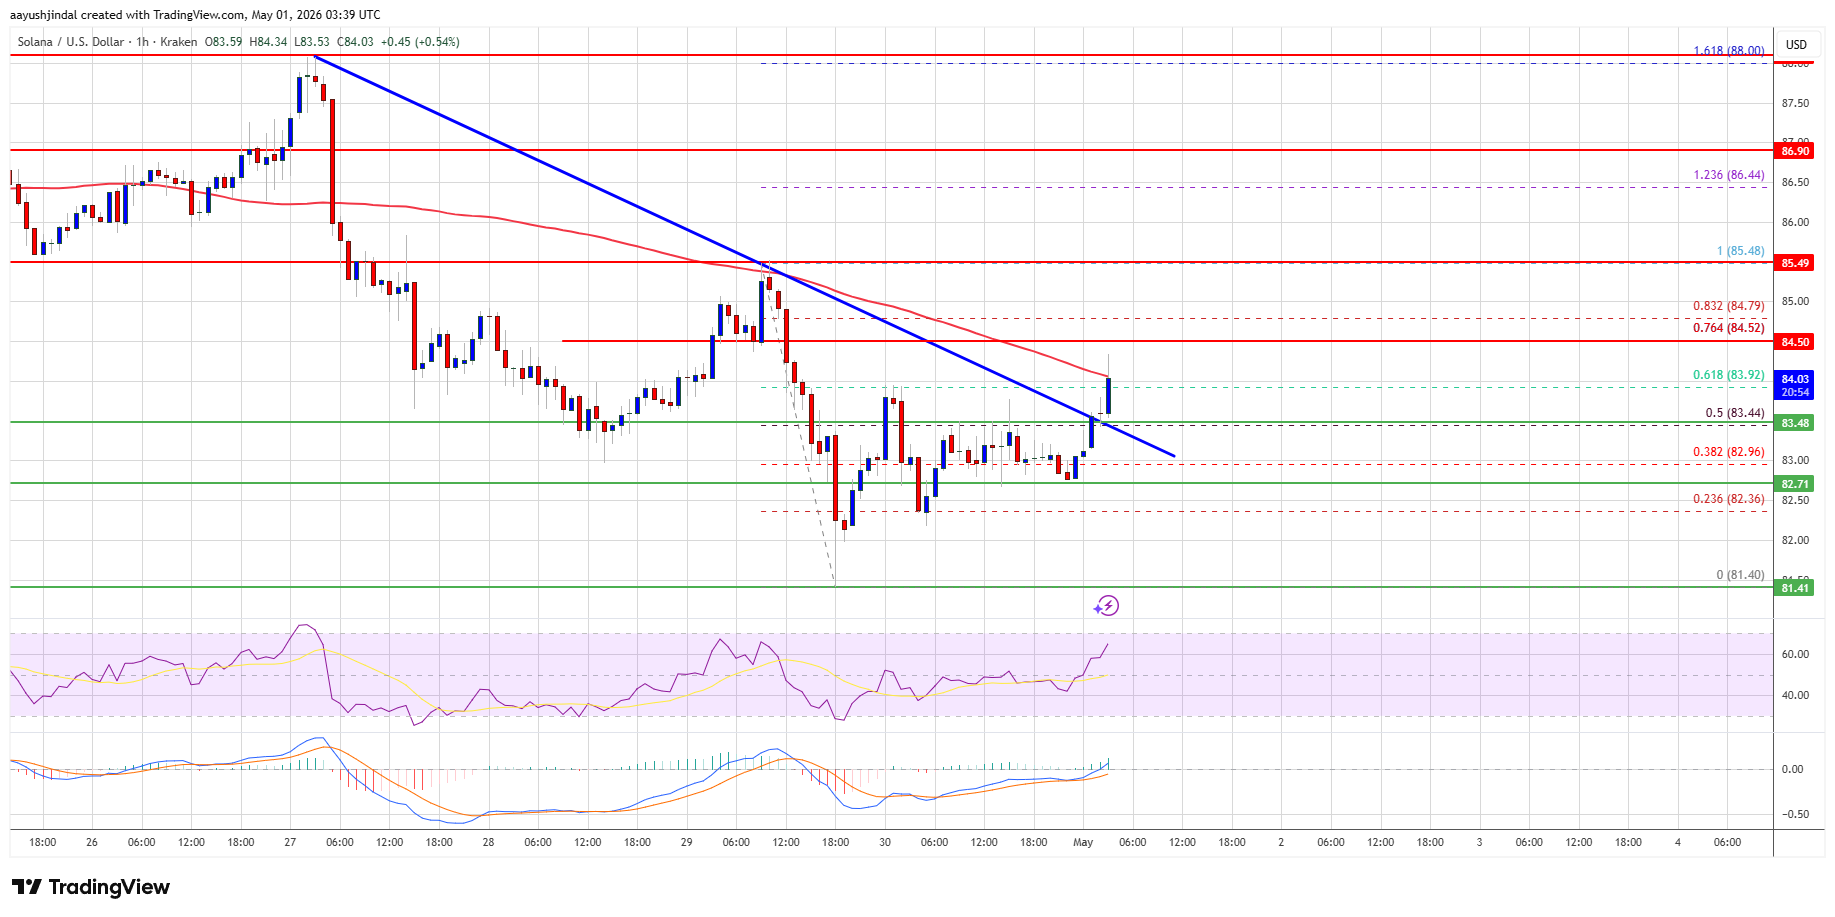
On the upside, immediate resistance is near the $84.50 level. The next major resistance is near the $85.50 level. The main resistance could be $87. A successful close above the $87 resistance zone could set the pace for another steady increase. The next key resistance is $92. Any more gains might send the price toward the $102 level.
Another Decline In SOL?If SOL fails to rise above the $85.50 resistance, it could continue to move down. Initial support on the downside is near the $83.45 zone. The first major support is near the $82.50 level.
A break below the $82.50 level might send the price toward the $81.40 support zone. If there is a close below the $81.40 support, the price could decline toward the $77 zone in the near term.
Technical Indicators
Hourly MACD – The MACD for SOL/USD is gaining pace in the bullish zone.
Hourly Hours RSI (Relative Strength Index) – The RSI for SOL/USD is above the 50 level.
Major Support Levels – $82.50 and $81.40.
Major Resistance Levels – $84.50 and $85.50.
Why this matters
Solana is a tracked market entity in the DigitalMoneyBox archive, making this useful context for readers monitoring repeated mentions and follow-up coverage.
Original source
Read on NewsBTCRelated market context

XRP Price Prediction: Ripple’s $700M Escrow Return Puts $1.59 Resistance in the Spotlight
The setup comes shortly after Ripple returned 700 million XRP, worth more than $1 billion, to escrow following its scheduled Octob...

Ethereum Layer 2 Blast Is Shutting Down, Saying Costs Now Exceed What the Chain Earns
Blast, the Ethereum layer 2 network created by Blur founder Tieshun “Pacman” Roquerre, is shutting down, its team announced on X o...

Bitcoin sees big overnight rally as ETF demand returns before the next US jobs test
Bitcoin retook $86,000 by the morning of Oct. 2 as demand for US spot Bitcoin ETFs recovered, with short covering a plausible acce...

XRP Price Prediction: Ripple Range-Bound at $1.50, Breakout Soon?
XRP price prediction shows Ripple entering October still trading within a broad range. XRP is currently around $1.50, with key res...

Fidelity explores wider access to its Ethereum tokenized money market fund
Fidelity's move to broaden access to its tokenized fund could democratize investment opportunities, impacting the DeFi landscape s...

XRP Price, $300M ETF Demand, and 45% Q3 Supply Overhang
XRP price rose more than 45% in Q3 as U.S. spot XRP ETFs attracted about $307.9 million, yet the token entered October near $1.50...