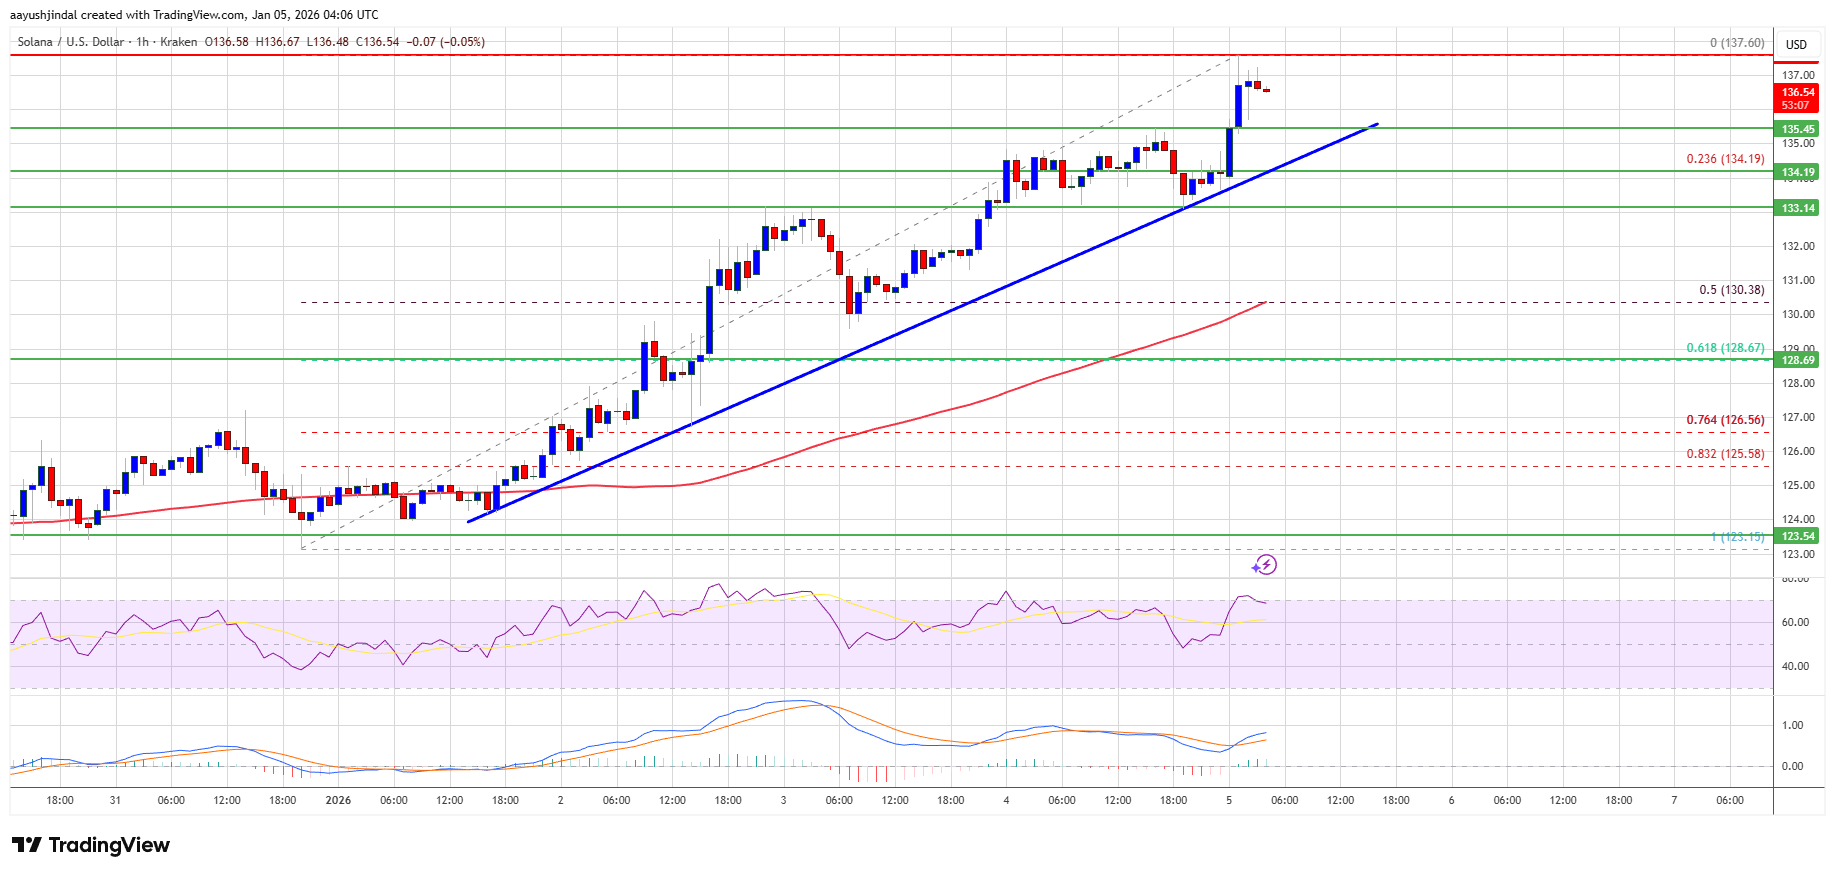
Solana (SOL) Reclaims 132 Level, Momentum Turns Sharply Bullish
Solana started a fresh increase above the $130 zone. SOL price is now consolidating above $132 and might aim for more gains above the $138 zone. SOL price started a fresh upward move above the $130 and $132 levels agains...
Archive context
Older archive item. Useful for background and entity history, but not a fresh market-moving signal.

Solana started a fresh increase above the $130 zone. SOL price is now consolidating above $132 and might aim for more gains above the $138 zone.
- SOL price started a fresh upward move above the $130 and $132 levels against the US Dollar.
- The price is now trading above $132 and the 100-hourly simple moving average.
- There is a bullish trend line forming with support at $135 on the hourly chart of the SOL/USD pair (data source from Kraken).
- The pair could extend gains if it clears the $140 resistance zone.
Solana price started a decent increase after it settled above the $125 zone, like Bitcoin and Ethereum. SOL climbed above the $130 level to enter a short-term positive zone.
The price even smashed the $132 resistance. The bulls were able to push the price above $135. The price is now consolidating gains above the 23.6% Fib retracement level of the recent upward move from the $123 swing low to the $138 high.
Solana is now trading above $135 and the 100-hourly simple moving average. Besides, there is a bullish trend line forming with support at $135 on the hourly chart of the SOL/USD pair.
On the upside, the price is facing resistance near $138. The next major resistance is near the $140 level. The main resistance could be $145. A successful close above the $145 resistance zone could set the pace for another steady increase. The next key resistance is $150. Any more gains might send the price toward the $155 level.
Another Decline In SOL?If SOL fails to rise above the $185 resistance, it could start another decline. Initial support on the downside is near the $134 zone and the trend line. The first major support is near the $130 level and the 50% Fib retracement level of the recent upward move from the $123 swing low to the $138 high.
A break below the $130 level might send the price toward the $128 support zone. If there is a close below the $128 support, the price could decline toward the $120 support in the near term.
Technical Indicators
Hourly MACD – The MACD for SOL/USD is gaining pace in the bullish zone.
Hourly Hours RSI (Relative Strength Index) – The RSI for SOL/USD is above the 50 level.
Major Support Levels – $135 and $130.
Major Resistance Levels – $138 and $140.
Why this matters
Solana is a tracked market entity in the DigitalMoneyBox archive, making this useful context for readers monitoring repeated mentions and follow-up coverage.
Original source
Read on NewsBTCRelated market context

Ethereum Price Prediction: Another Protocol Hacked for $7.5 Million
Ethereum price prediction has turned more cautious after the Verus Ethereum bridge suffered a $7.5 million exploit, raising fresh...

Worldcoin (WLD) Price Prediction: Can Grayscale’s Worldcoin ETF Filing Trigger a WLD Rebound Above $0.45?
The filing has put the token back in focus at a time when WLD remains well below its recent 2026 highs and technical indicators co...
XRP Price Breaks Resistance, But ETF Flows Warn Bulls
XRP price climbed from around $1.11 to $1.14 during the past week, briefly testing resistance near $1.16 before easing back despit...

Swiss Cantonal Bank BancaStato Adds Bitcoin And Ethereum Trading With Sygnum
A Swiss cantonal bank has moved crypto trading directly into its normal banking experience, and that is the part of the story that...

Latest $3.8 billion RWA recovery shows how quickly DeFi absorbed the KelpDAO shock
Active use of tokenized real-world assets in DeFi has returned to about $3.77 billion, close to the level visible before an April...

LayerZero, Keeta enable tokenized bank deposits across Ethereum, Solana and Base
LayerZero and Keeta have partnered to enable native transfers of tokenized bank deposits across Ethereum, Solana, Base, and Keeta.