Solana (SOL) Recovery Faces Roadblocks, Can Bulls Push Through?
Solana found support at $77 and corrected some losses. SOL price is now consolidating above $80 and might aim for a steady increase. SOL price started a decent recovery wave above $80 and $82 against the US Dollar. The p...
Archive context
Older archive item. Useful for background and entity history, but not a fresh market-moving signal.

Solana found support at $77 and corrected some losses. SOL price is now consolidating above $80 and might aim for a steady increase.
- SOL price started a decent recovery wave above $80 and $82 against the US Dollar.
- The price is now trading above $80 and the 100-hourly simple moving average.
- There was a break above a key bearish trend line with resistance at $80 on the hourly chart of the SOL/USD pair (data source from Kraken).
- The price could continue to move up if it clears $82.80 and $85.
Solana price remained stable and started a decent recovery wave from $77, like Bitcoin and Ethereum. SOL was able to climb above the $80 level.
There was a move above the 50% Fib retracement level of the downward move from the $86.63 swing high to the $76.70 low. Besides, there was a break above a key bearish trend line with resistance at $80 on the hourly chart of the SOL/USD pair.
However, the bears are active near $82.80. Solana is now trading above $80 and the 100-hourly simple moving average. On the upside, immediate resistance is near the $82.80 level or the 61.8% Fib retracement level of the downward move from the $86.63 swing high to the $76.70 low.
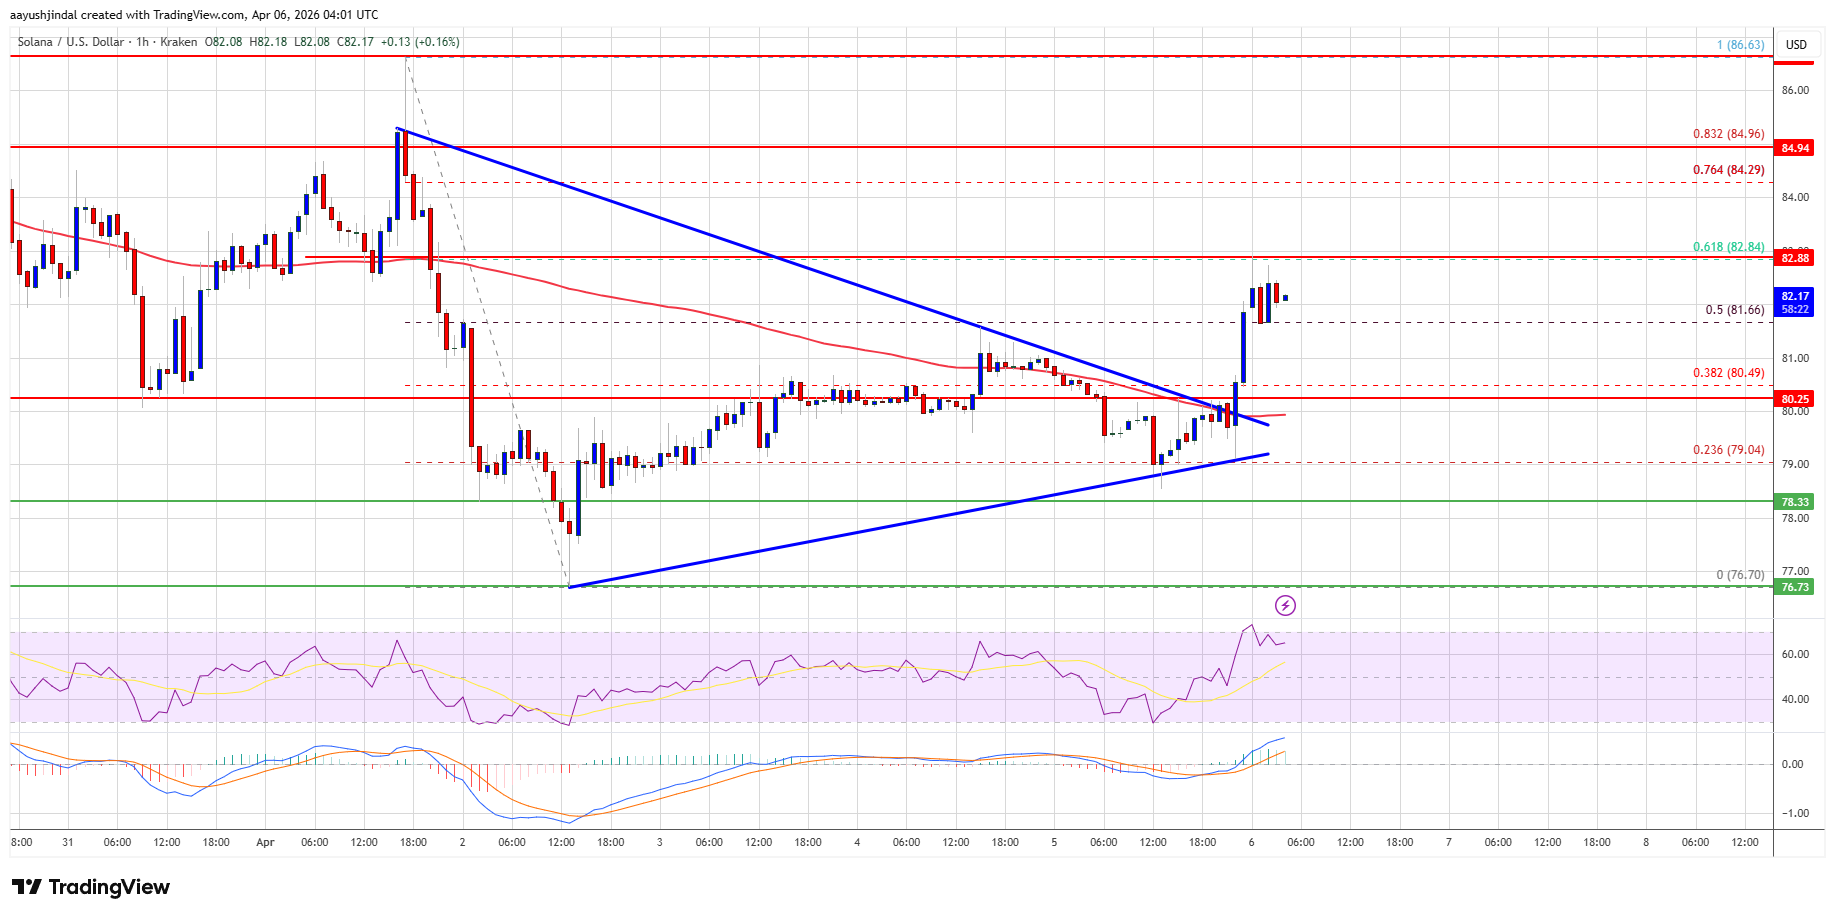
The next major resistance is near the $85 level. The main resistance could be $88. A successful close above the $88 resistance zone could set the pace for another steady increase. The next key resistance is $95. Any more gains might send the price toward the $102 level.
Another Decline In SOL?If SOL fails to rise above the $82.80 resistance, it could continue to move down. Initial support on the downside is near the $80 zone. The first major support is near the $77 level.
A break below the $77 level might send the price toward the $75 support zone. If there is a close below the $75 support, the price could decline toward the $66 zone in the near term.
Technical Indicators
Hourly MACD – The MACD for SOL/USD is gaining pace in the bullish zone.
Hourly Hours RSI (Relative Strength Index) – The RSI for SOL/USD is above the 50 level.
Major Support Levels – $80.00 and $77.00.
Major Resistance Levels – $82.80 and $85.00.
Why this matters
Solana is a tracked market entity in the DigitalMoneyBox archive, making this useful context for readers monitoring repeated mentions and follow-up coverage.
Original source
Read on NewsBTCRelated market context

Ethereum Price Prediction: ETH Liquidity Drops 45% Below BTC
Ethereum price prediction is dropping as its order-book depth has fallen to 35–45% of Bitcoin’s. Ethereum trades at $2,725, up 1%...

Ethereum surges nearly 70% in Q3, but its order books thin out against Bitcoin
Ethereum's liquidity challenges could lead to increased market volatility, impacting traders' strategies and potentially amplifyin...

Ethereum liquidity drops below 50% of Bitcoin’s level
Ethereum's reduced liquidity compared to Bitcoin may lead to increased trading costs and volatility, impacting institutional tradi...

Ethereum’s past outflow charts can change when more exchange wallets are identified
Coin Metrics has rebuilt Ethereum's historical Standard Flow Metrics, raising a timing problem for tests that treat exchange outfl...

Claude AI Predicts an Astonishing Finish to the Year for XRP
Claude AI predicts that by January 1, 2027, XRP USD could hit $25, with a blow-off top target of $35, if a very specific catalyst...

XRP Price Prediction: Analyst Calls $750 Ripple Next Year
XRP traded at $1.51, printing 1% gain as its price prediction was pinned near the middle of its recent range. Jake Claver is still...