Solana (SOL) Revs Up Again – Fresh Breakout Above $200 in Sight?
Solana started a fresh increase above the $188 zone. SOL price is now consolidating gains and might aim for more gains above the $200 zone. SOL price started a fresh upward move above the $180 and $185 levels against the...
Archive context
Older archive item. Useful for background and entity history, but not a fresh market-moving signal.

Solana started a fresh increase above the $188 zone. SOL price is now consolidating gains and might aim for more gains above the $200 zone.
- SOL price started a fresh upward move above the $180 and $185 levels against the US Dollar.
- The price is now trading above $188 and the 100-hourly simple moving average.
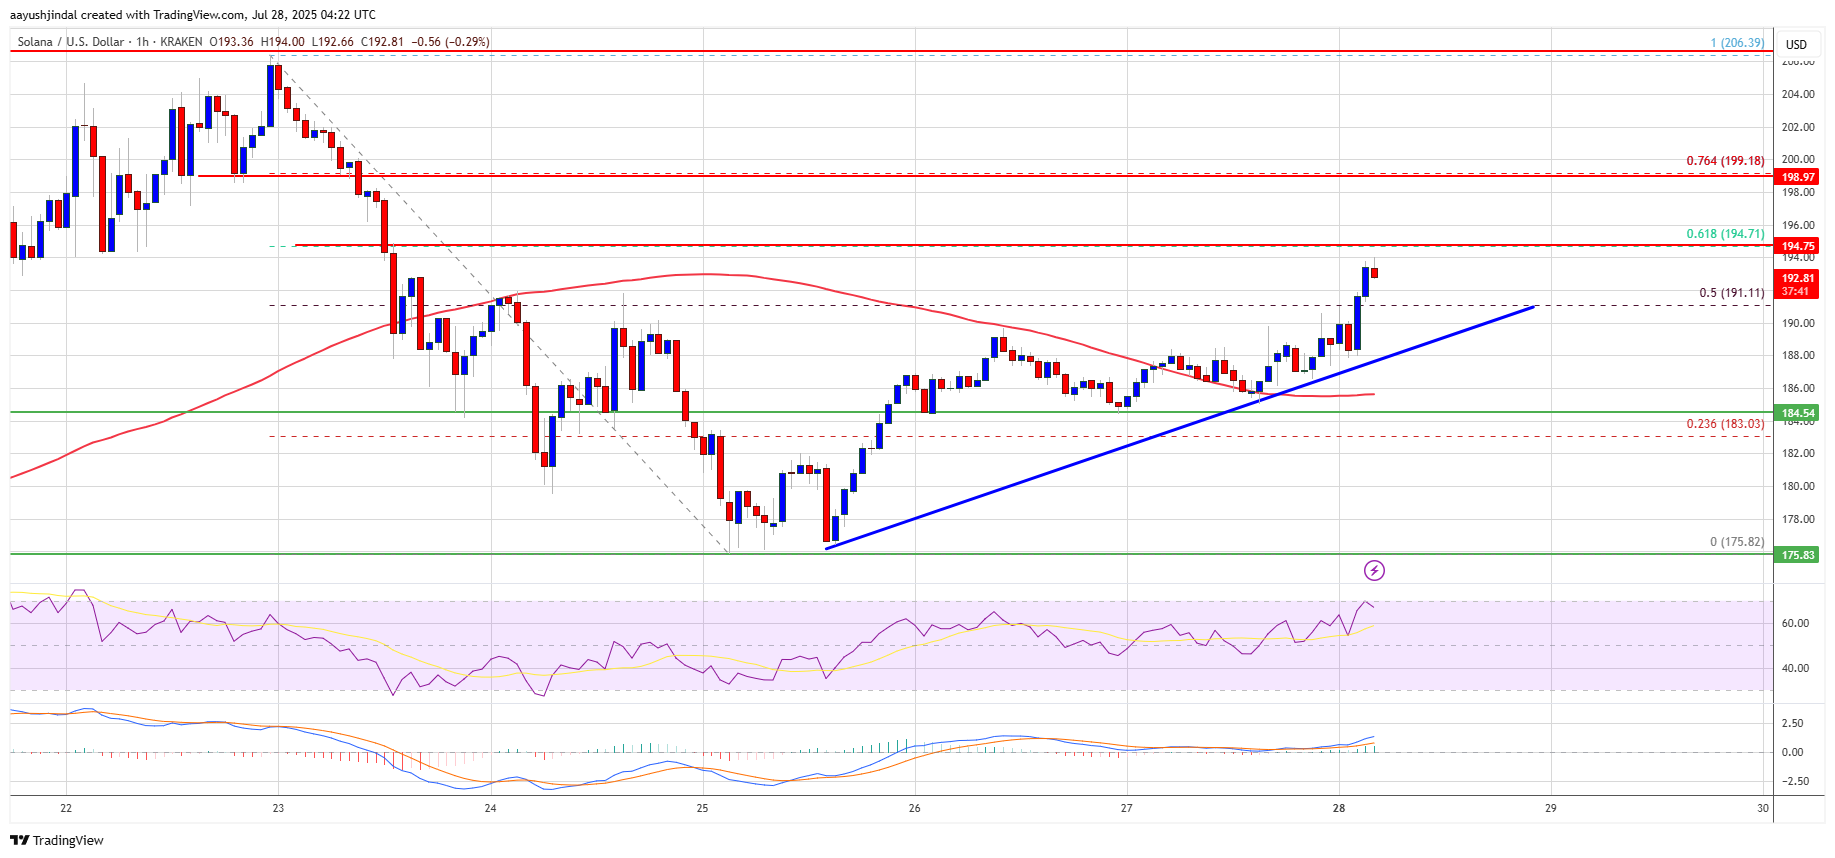
- There is a key bullish trend line forming with support at $190 on the hourly chart of the SOL/USD pair (data source from Kraken).
- The pair could start a fresh increase if it clears the $200 resistance zone.
Solana price started a decent increase after it found support near the $175 zone, like Bitcoin and Ethereum. SOL climbed above the $180 level to enter a short-term positive zone.
The price even smashed the $185 resistance. The bulls were able to push the price above the 50% Fib retracement level of the downward move from the $206 swing high to the $175 low. There is also a key bullish trend line forming with support at $190 on the hourly chart of the SOL/USD pair.
Solana is now trading above $190 and the 100-hourly simple moving average. On the upside, the price is facing resistance near the $195 level. It is close to the 61.8% Fib retracement level of the downward move from the $206 swing high to the $175 low.
The next major resistance is near the $198 level. The main resistance could be $200. A successful close above the $200 resistance zone could set the pace for another steady increase. The next key resistance is $212. Any more gains might send the price toward the $225 level.
Are Downsides Limited In SOL?If SOL fails to rise above the $200 resistance, it could start another decline. Initial support on the downside is near the $190 zone and the trend line. The first major support is near the $188 level.
A break below the $188 level might send the price toward the $184 support zone. If there is a close below the $184 support, the price could decline toward the $175 support in the near term.
Technical Indicators
Hourly MACD – The MACD for SOL/USD is gaining pace in the bullish zone.
Hourly Hours RSI (Relative Strength Index) – The RSI for SOL/USD is above the 50 level.
Major Support Levels – $190 and $188.
Major Resistance Levels – $195 and $200.
Why this matters
This altcoin story adds another data point to the current market tape and is useful when read alongside nearby source coverage.
Original source
Read on NewsBTCRelated market context

XRP Price Prediction: XRP Faces Critical Resistance Near $1.17 Despite Ripple Securing Landmark EU License
While the company secured a full MiCA license that expands its operations across the European Economic Area, market indicators sug...

Bitcoin (BTC) Price Prediction: BTC Holds $63K Support—Can Rising Active Addresses Offset Bearish Technical Signals?
Although the BTC price has remained near a key support zone, recent chart signals and Strategy’s sale of a portion of its Bitcoin...

Bitcoin price rebounds to $63K as leverage returns creating short term volatility risk
Bitcoin's rebound has cleared the first test: price recovered. The harder one starts now: proving buyers remain after the squeeze....
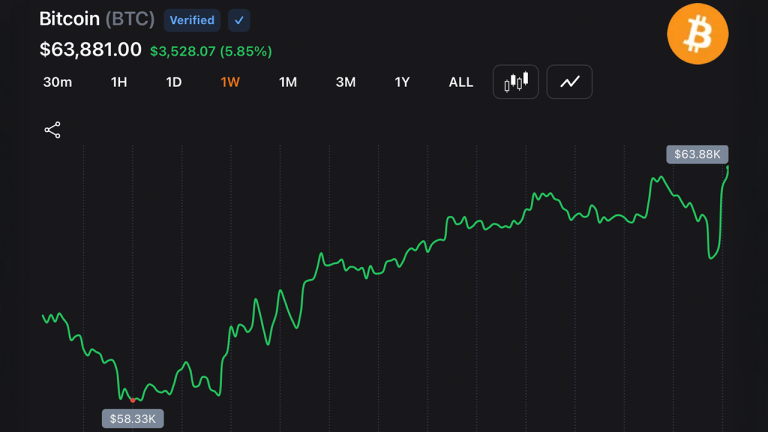
Bitcoin Rebounds Above $63,500 After Strategy’s $216M Sale Triggers $214M in Short Liquidations
Bitcoin nearly reached $64,000 over the weekend before a sharp Monday morning drop dragged it to an intraday low of $61,246. It qu...

Bitcoin and Solana ETFs see renewed inflows after heavy selling
Renewed inflows into Bitcoin and Solana ETFs suggest potential market stabilization and increased investor confidence in crypto as...
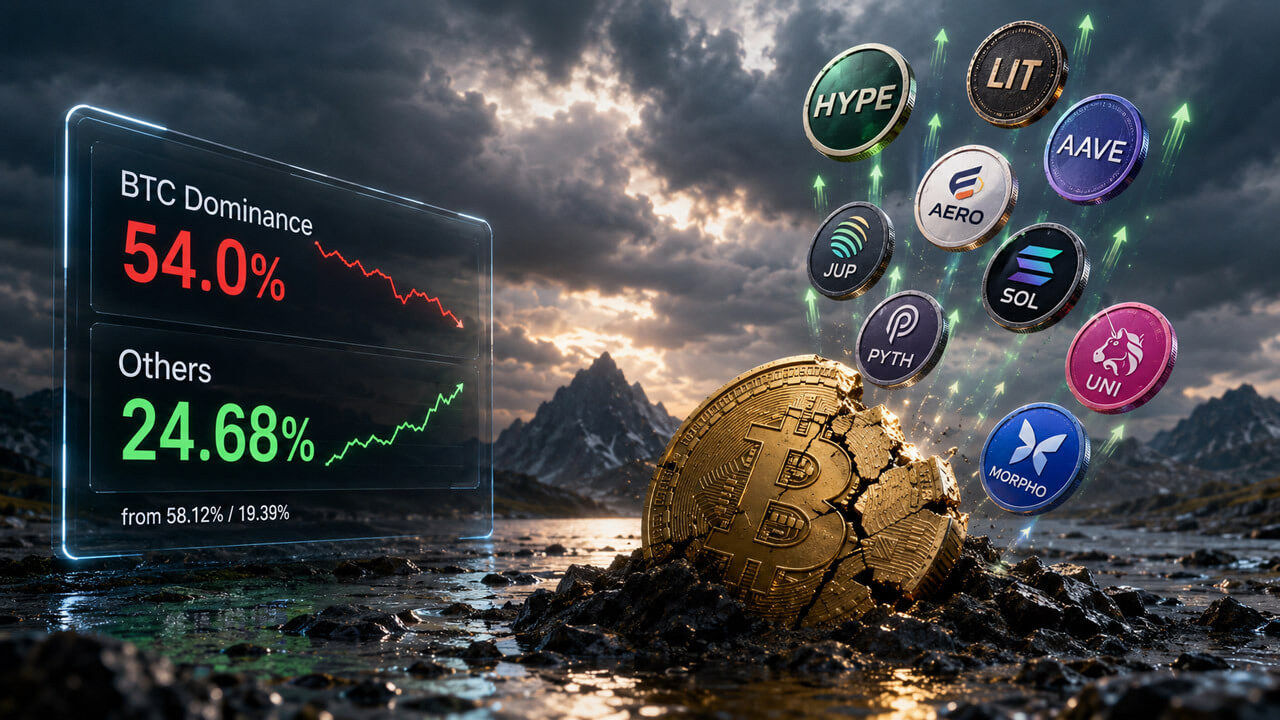
Bitcoin dominance hits one-month low as altcoin winners start breaking away
Bitcoin's dominance dropped to a one-month low of 54%, down from 58.12%, according to CoinGecko's dominance table. Over the same s...